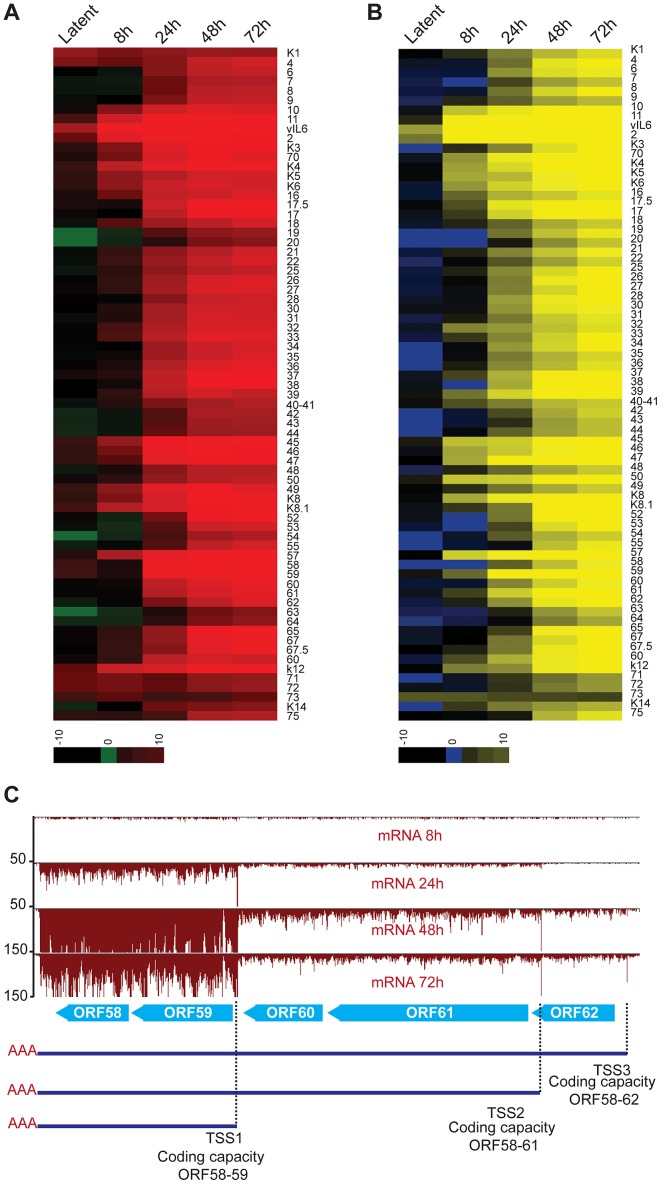
Figure 8. Lytic reactivation is subject to a transcriptional timer.
(A–B) Log2 of normalized mRNA-Seq (A) and Ribo-Seq (B) counts (reads per kilobase million, rpkM) was calculated for the primary ORFs. The log2 scores reflect mRNA-expression (mRNA-seq) or ribosome occupancy (Ribo-seq) for each gene. The ORFs are organized by genomic position from ORFK1 to ORF75. The ORFs that were not annotated in our study have not been included in the plots (C) mRNA-Seq for the ORF58–62 locus. Three TSS sharing a single PAS were mapped in this region. Note the timing of expression for each of the transcripts.

