
Figure 1. TREM-1 surface expression by peripheral blood myeloid cell subsets from wildtype versus Trem1-deficient mice.
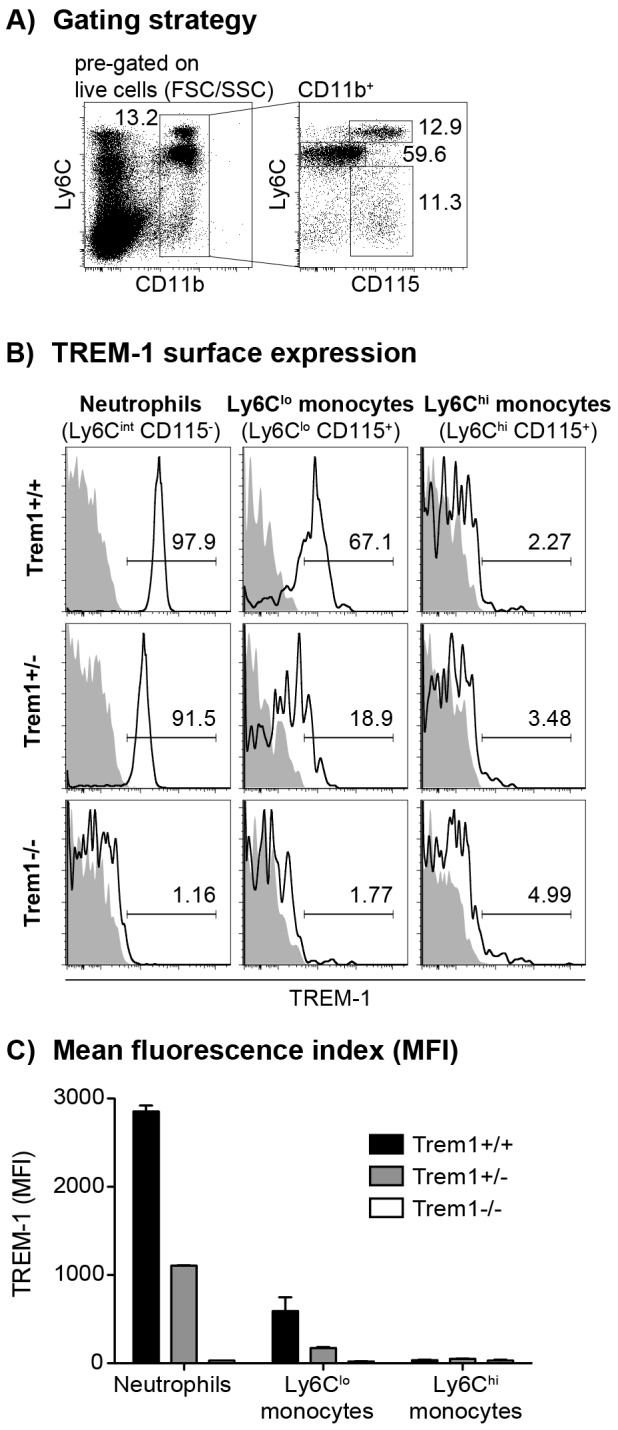
Peripheral blood cells obtained from wildtype (Trem1+/+) and Trem1-deficient (Trem1+/− and Trem1−/−) mice (n = 2 mice for each group) were stained for surface expression of TREM-1 and analysed by FACS. (A) Representative gating strategy to identify neutrophils and LyC6lo and Ly6Chi monocytes. (B) Representative histograms showing TREM-1 surface expression (lines) versus isotype controls (filled histograms). (C) Mean fluorescence intensity (MFI) of TREM-1 surface expression. Mean values of n = 2 mice analysed are shown with error bars indicating the range. Data are representative of several independent analyses.