
Figure 3. Trem1−/− x Rag2−/− mice are protected from a CD4+ T cell-induced colitis.
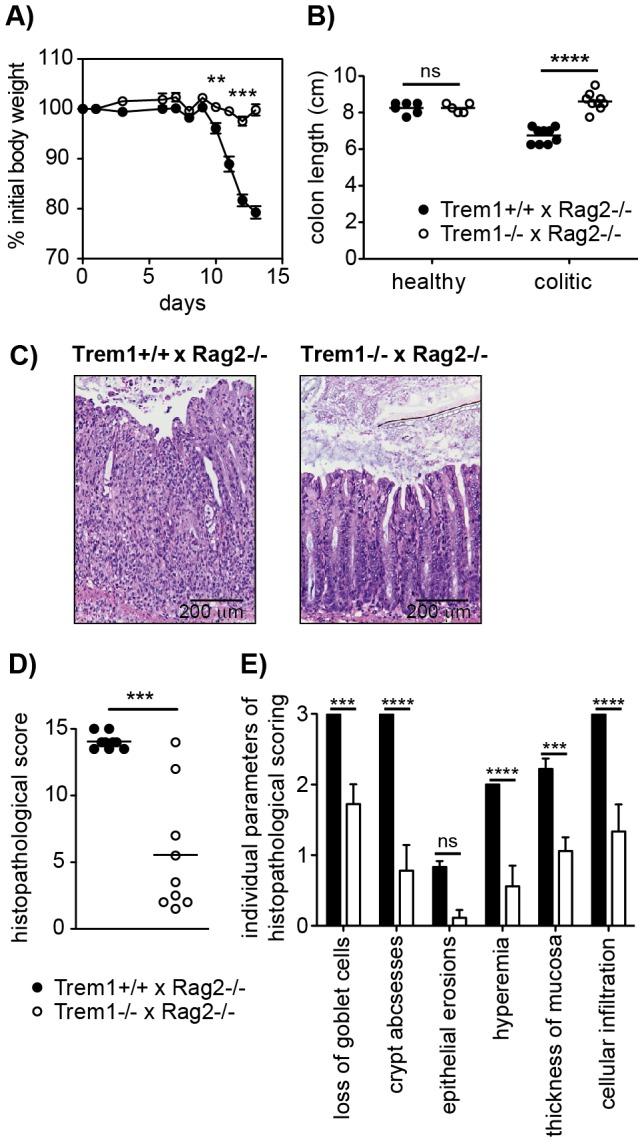
Colitis was induced in Trem1+/+ x Rag2−/− (filled circles) and Trem1−/− x Rag2−/− mice (white circles) by i.p. injection of 2×10⁵ CD4+ CD45RBhi T cells. (A) Weight loss relative to the initial body weight. Mean values of n = 9 mice analysed per group are shown with error bars indicating the SEM. (B) Colon lengths were determined in individual mice (symbols). Lines show mean values for each group of mice. (C) Representative H&E-stained colonic tissue sections of a Trem1+/+ x Rag2−/− (histopathological score: 14) and Trem1−/− x Rag2−/− mouse (histopathological score: 2). (D) Total histopathological scores. Symbols show total scores for individual mice and lines indicate the mean value for each group of mice. Histopathological scores were determined for individual mice by a pathologist according to parameters defined in the Materials and Methods section. (E) Individual parameters of histopathological scoring. Columns show mean values for n = 9 mice analysed per group and error bars indicate the SEM. ****, p<0.0001; ***, p<0.001; **, p<0.01. One representative experiment out of three independent experiments is shown.