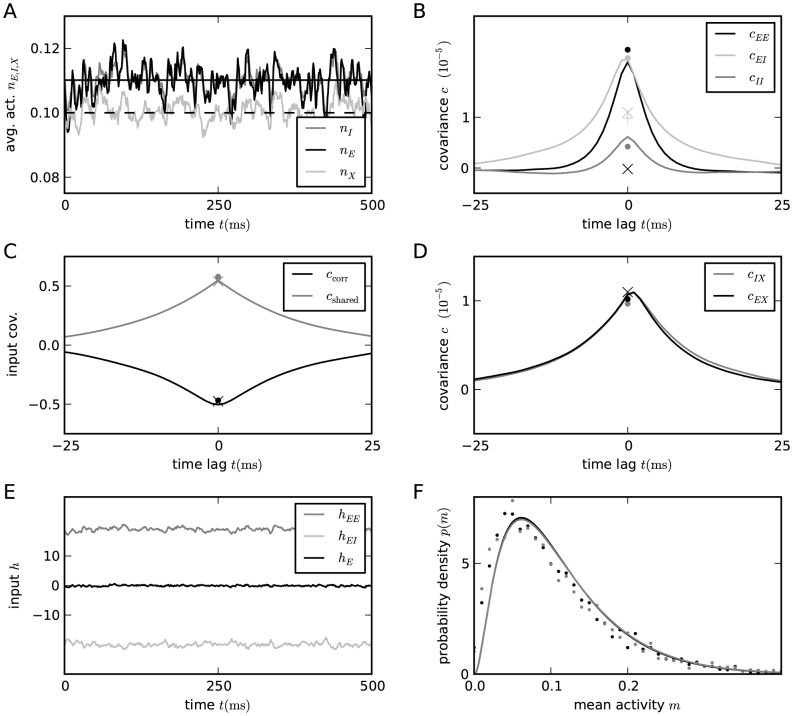
Figure 4. Activity in a network of  binary neurons as described in [24, their Fig. 2], with
  ,
,  ,
,  ,
,  ,
,  ,
,  .
.
Number  of synaptic inputs binomially distributed as
  , with connection probability
  . A Population averaged activity (black
  , gray
  , light gray
  ). Analytical prediction (5) for the mean activities
  (dashed horizontal line) and numerical solution of mean field equation (7) (solid horizontal line). B Cross correlation between excitatory neurons (black curve), between inhibitory neurons (gray curve), and between excitatory and inhibitory neurons (light gray curve) obtained from simulation. St. Andrew's Crosses show the theoretical prediction from [24, supplement, eqs. 38,39] (prediction yields
  , so only one cross is visible). Dots show the theoretical prediction (24). The plus symbol shows the prediction for the correlation
  when terms proportional to
  and
and  are set to zero. C Correlation between the input currents to a pair of excitatory neurons. Contribution due to pairwise correlations
  (black curve) and due to shared input
  (gray curve). Symbols show the theoretical predictions based on [24] (crosses) and based on (24) (dots). D Similar to B, but showing the correlations between external neurons and neurons in the excitatory and inhibitory population. E Fluctuating input
  averaged over the excitatory population (black), separated into contributions from excitatory synapses
  (gray) and from inhibitory synapses
  (light gray). F Distribution of time averaged activity obtained by direct simulation (symbols) and analytical prediction (17) using the numerically evaluated self-consistent solution for the first
  and second moments
  ,
,  (19). Duration of simulation
  , mean activity
  , other parameters as in Figure 3.

