
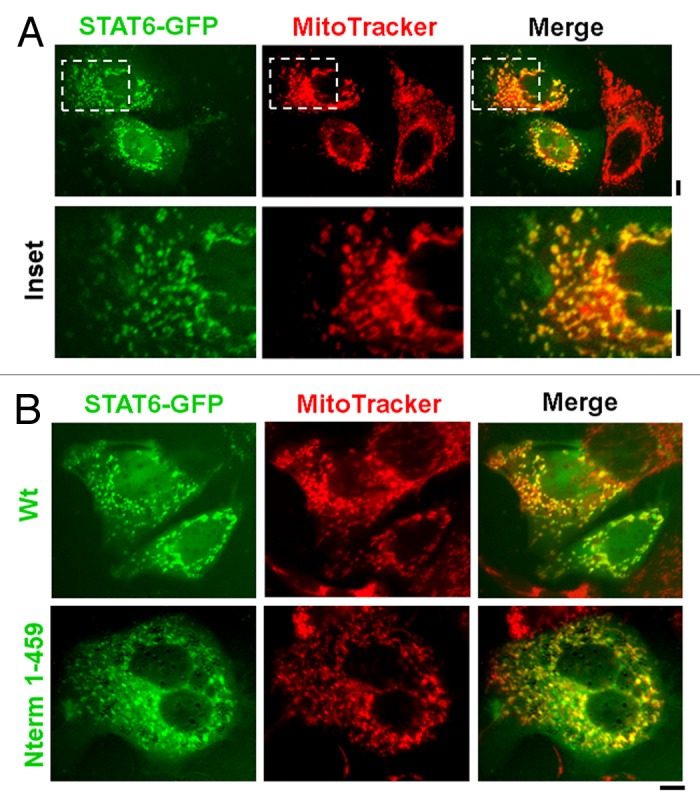
Figure 6. Live-cell imaging of STAT6-GFP and of its N-terminal truncation with mitochondria. (A) Hep3B cells in 35-mm plates were transfected with the STAT6-GFP expression plasmid and 2 d later the cultures were exposed to MitoTracker Red CMXRos at 100 nM for 15 min. After washing with PBS the live cells were imaged using a 40× water-immersion objective in green (STAT6-GFP) and red (MitoTracker). Insets depicted within each panel in the top row are shown at high magnification in the bottom row. Scale bars = 10 µm. Quantitative colocalization analyses using the Pearson’s and Costes’ plugins in Image J confirmed colocalization between STAT6-GFP and MitoTracker fluorescence at a setting of p < 0.05 in this experiment. (B) Hep3B cells in 35-mm plates were transfected with expression constructs for either the full-length or the N-terminal 1–459 truncated version of STAT6-GFP. Two days later the plates were exposed to MitoTracker Red CMXRos at 100 nM for 15 min (B) and imaged as (A). Scale bars = 10 µm. Illustrations in this composite figure were adapted from reference 18.