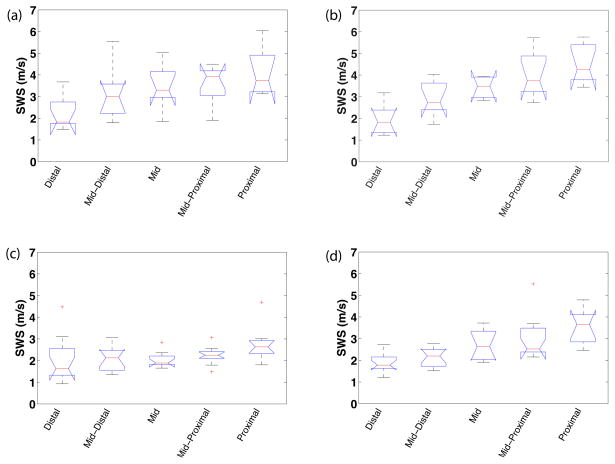
Figure 4.
Box plots of mean SWS from each sample vs. cervical canal location for each group and cervix half: unripened (a–b) and ripened (c–d); anterior (a,c) and posterior (b,d) slices. The boxes represent interquartile range (IQR), interior line is median, whiskers are maxima and minima within 1.5*IQR, and cross markers show outliers beyond the 1.5*IQR.

