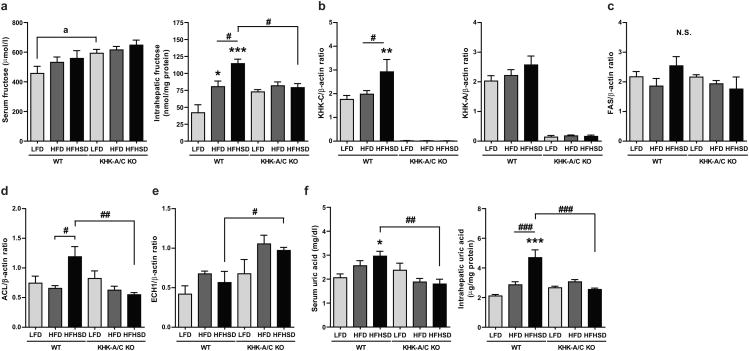
Figure 5.
WT mice and KHK-A/C KO mice were given ad libitum LFD, HFD or HFHSD for 15 weeks (n = 7-8). (a) Left panel: Serum fructose concentration (n = 7-8). Right panel: Fructose content in liver (n = 6). (b) Quantitative real-time PCR for mouse KHK-C (left panel) and KHK-A (right panel) in liver (n = 6-7). (c-e) Western blot analysis of mouse fatty acid synthase (FAS, c), ATP citrate lyase (ACL, d) and mouse enoyl CoA-hydratase (ECH1, e) in liver (n = 4). β-actin was used as an internal control. (f) Left panel: Serum uric acid concentration (n = 7-8). Right panel: Uric acid content in liver (n = 6). Data represent means (x000B1) s.e.m. *P < 0.05, **P < 0.01, ***P < 0.001 vs. respective LFD group. #P < 0.05. ##P < 0.01. ### P < 0.001. a, P < 0.05 by t-test. N.S., not significant.

