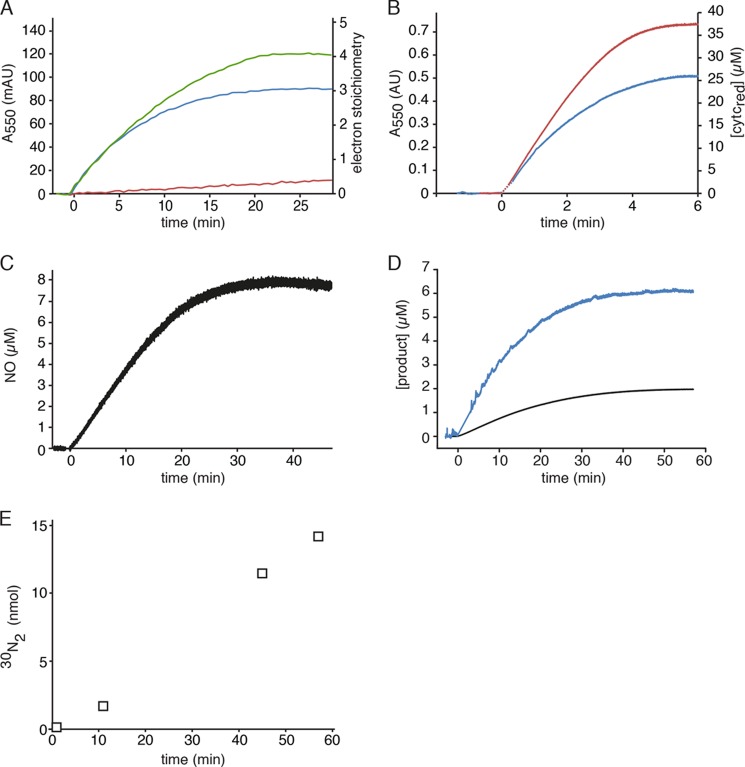
FIGURE 1.
Hydroxylamine and hydrazine oxidation by kustc1061 and NeHAO. A, cytochrome c reduction (50 μm) catalyzed by kustc1061 (200 ng) in the presence of 1.5 μm hydroxylamine (blue) or 1.5 μm hydrazine (red). The oxidation of hydroxylamine (1.5 μm) coupled to the reduction of cytochrome c (50 μm) by NeHAO (30 ng) is represented by the green curve. Reactions were followed and quantified by measuring the increase in the absorption at 550 nm (Δϵ550 = 19,600 m−1 cm−1) as the result of cytochrome c reduction. B, hydroxylamine oxidation (9 μm) by 1.4 μg of kustc1061 (blue) and hydrazine oxidation (9 μm) by 20 μg of kustc1061 (red) recorded by measuring the reduction of cytochrome c at 550 nm (Δϵ550 = 19,600 m−1 cm−1, right axis). C, NO production from hydroxylamine (8 μm) by kustc1061 (150 ng) in the presence of 50 μm cytochrome c. NO formation was followed by recording the increase in fluorescence as the result of the formation of the nitrosylated derivative of Cu(II)FL2E and was quantified from a calibration curve prepared from known NO stock solutions. D, hydroxylamine oxidation (2 μm) recorded by the increase in fluorescence resulting from the formation of a nitrosylated derivative of the NO-probe 4-amino-5-methylamino-2′,7′-difluorofluorescein (black) and cytochrome c reduction under the same conditions (blue), showing a 1:3 stoichiometry of NO production versus cytochrome c reduction. E, accumulation of 30N2 during [15N]hydrazine oxidation. 15N15N (open squares) was produced upon addition of 7.5 μm H15N-15NH to 2 ml of 20 mm potassium Pi buffer containing 1.3 μg of kustc1061 and 50 μm oxidized cytochrome c. The concentration of reduced cytochrome c was determined as in A. NO in C and D was quantified from calibration curves prepared from known NO stock solutions.

