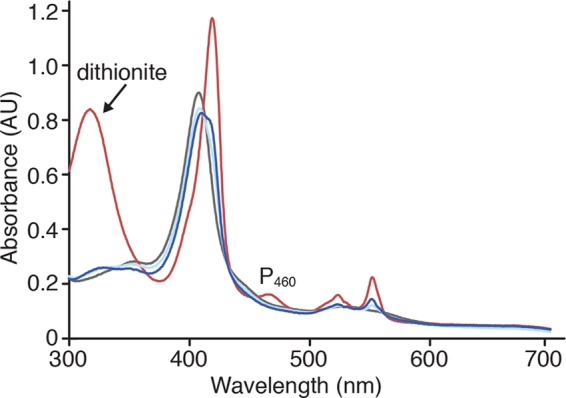
FIGURE 2.

Electronic absorbance spectra of kustc1061. Spectra are the following: as-isolated (fully oxidized) kustc1061 (80 μg ml−1) (gray), dithionite-reduced kustc1061 (red), and the as-isolated enzyme incubated either with 100 μm hydroxylamine (dark blue) or with 100 μm hydrazine (light blue).
