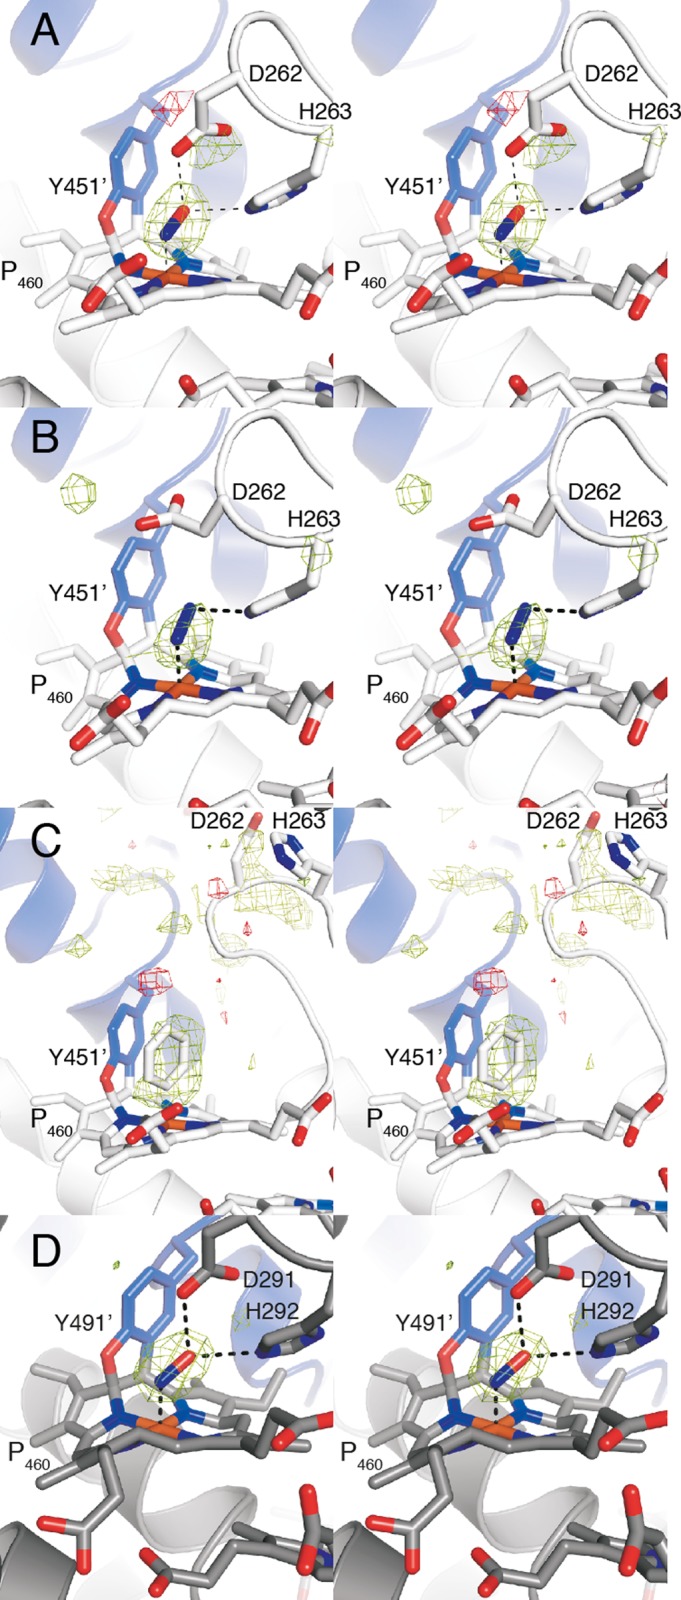
FIGURE 7.

Stereo views of Fo − DFc electron density maps for the substrate soaks, calculated prior to the inclusion of the ligands in the model. Positive difference density (green) is contoured at 4 σ, and negative difference density (red) is contoured at −4 σ. A, kustc1061 soaked in NH2OH. B, kustc1061 soaked in hydrazine. C, kustc1061 soaked in phenyl hydrazine. D, Nitrosomonas HAO soaked in NH2OH.
