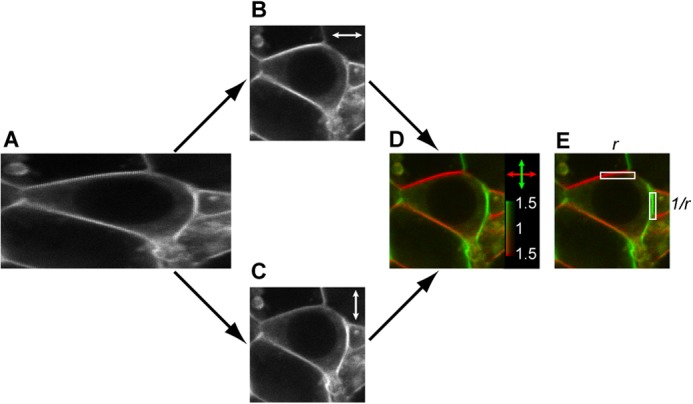
FIGURE 1.

2PPM image processing illustrated on an example of a cell expressing the GAP43-CFP-Gαi2, Gβ1, and Gγ2 constructs. A, raw 2PPM image containing pixels obtained with both excitation light polarizations. B and C, images of fluorescence elicited with horizontally (B) and vertically (C) polarized excitation light, respectively (double-headed arrows), obtained by deinterleaving image A. D, linear dichroism image, obtained from images B and C, after adjustments for differences in laser beam intensity and pulse duration between the two polarizations and application of a lookup table designed to express fluorescence intensity by brightness and values of the dichroic ratio (r) by hue. The color scale indicates an excess of fluorescence excited by vertical polarization (Fv) in green and an excess of fluorescence excited by horizontal polarization (Fh) in red. E, pixels from horizontal and vertical parts of the cell outline are used for calculation of the maximum dichroic ratio. The maximum dichroic ratio rmax (and log2(rmax)) is obtained by calculating the mean values of r (and log2(r)) from horizontal and 1/r (and log2(1/r)) from vertical parts of the cell outline.
