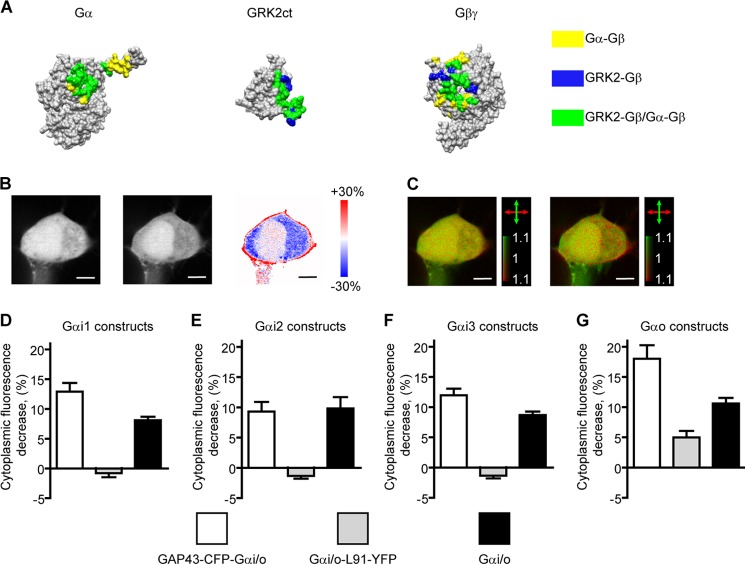
FIGURE 5.
Investigating interactions between G protein subunits by imaging GRK3ct-FP translocation. A, structures of Gαi1 (PDB code 1GP2 (33)), the C-terminal part of GRK2 (GRK2ct, PDB code 1OMW (20)), and Gβ1γ2 (PDB code 1OMW (20)). The sites of interactions of Gβ1γ2 with Gαi1 only are colored yellow (34), with GRK2ct only shown blue, and with both Gαi1 and GRK2ct shown in green (20). A major overlap between the Gβ1γ2 surfaces interacting with Gαi1 and GRK2ct is apparent. B, two-photon microscopy images of yellow fluorescence of a typical cell transfected with the GAP43-CFP-Gαo, Gβ1, Gγ2, α2AR, and GRK3ct-Venus constructs imaged before and after application of 1 μm NE and a ratio image of the two images color-coded to express the fluorescence intensity ratio by hue. Translocation of GRK3ct-Venus, evidenced by a fluorescence intensity decrease in the cytoplasm accompanied by an increase in the cell membrane regions, is apparent. Scale bars = 5 μm. C, 2PPM images of GRK3ct-Venus before and after application of 1 μm NE (data acquired simultaneously with the images in B). Coloring is as in Fig. 1. Upon activation, the appearance of LD can be discerned, indicative of membrane localization of the GRK3ct-Venus construct. D–G, graphs of GRK3ct-FP translocation, indicated by a decrease of cytoplasmic GRK3ct-FP fluorescence (in percent) upon G protein activation for constructs of the GAP43-CFP-Gαi/o (white bars) and Gαi/o-L91-YFP (gray bars) designs and for non-modified Gαi/o constructs (black bars). Error bars represent the mean + S.E.). Activation of all GAP43-CFP-Gαi/o, Gαo-L91-YFP, and non-modified Gαi/o constructs leads to GRK3ct-FP translocation. In contrast, no GRK3ct-FP translocation can be detected in cells expressing Gαi-L91-YFP constructs.

