
FIGURE 4.
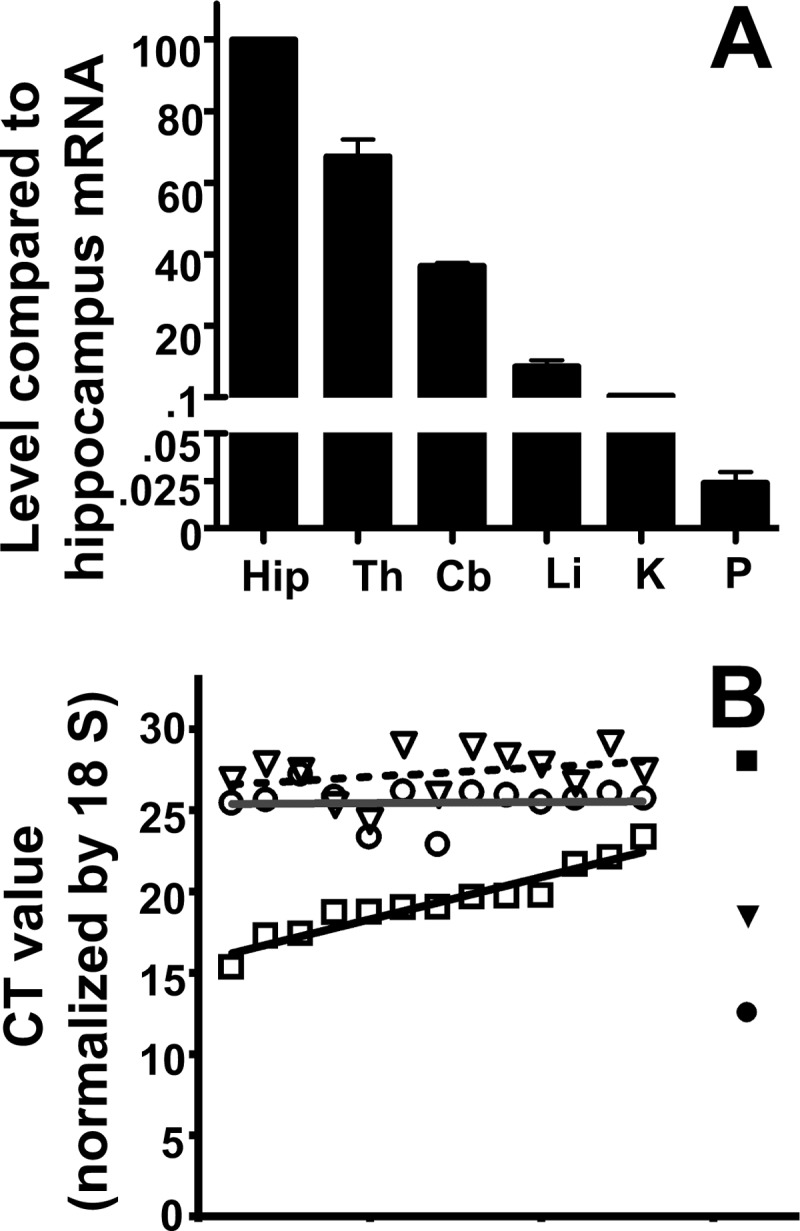
The levels of EAAT2 and VGLUT3 mRNAs are very low. A, TaqMan real time PCR was used to compare the levels of EAAT2 mRNA in brain regions (Hip, hippocampus; Th, thalamus; Cb, cerebellum) with those in liver (Li), kidney (K), and whole pancreas (P). The tissues were collected from three 6–9-week-old mice. Data were normalized to 18 S mRNA levels determined by RT-PCR. Note that the EAAT2 mRNA levels in the liver and in the whole pancreas were 10 and 4000 times lower, respectively, than in the hippocampus. B, multiple small pieces (less than 1 mg) of pancreatic tissue were collected from the body of pancreas. The levels of mRNAs encoding VGLUT3 (open triangles), EAAT2 (open circles), and glucagon (open squares) were determined, and the data (cycle threshold (CT) values) were sorted and plotted according to glucagon levels. Consequently, the graph shows increasing glucagon levels. Hippocampus was used as a control (solid symbols). Note that the EAAT2 levels in the pancreas did not correlate with the glucagon levels (the line is horizontal). Also note that the cycle threshold values for VGLUT3 in the pancreas are similar to those of glucagon in the hippocampus, indicating that VGLUT3 is close to transcription background (higher cycle threshold values means lower mRNA levels as the cycle threshold values represent the number of PCR cycles needed to reach the detection threshold). The tissues were collected from 6–7-week-old mice. The data are from two independent experiments.