
FIGURE 8.
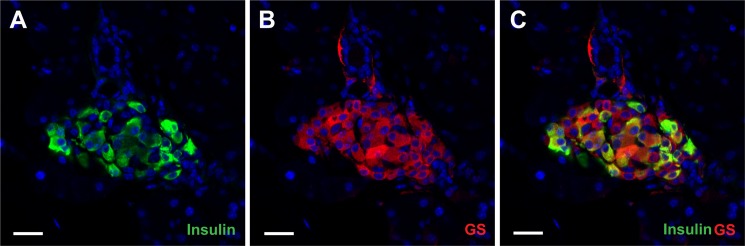
Confocal images show glutamine synthethase (GS; red; B) and insulin (green; A) distributions in young adult mouse pancreas. C is a merged image showing both glutamine synthethase and insulin. The islets were strongly labeled with anti-glutamine synthethase antibodies (Sigma G2781; 1:1,000), whereas the exocrine pancreas was virtually unlabeled in agreement with the proteome data (Table 3). Within islets the glutamine synthethase labeling was not restricted to one cell type as glutamine synthethase immunoreactivity was prominent in both insulin-positive and insulin-negative cells (anti-insulin antibody, Sigma I2018; 1:500). Furthermore, the intensity of the glutamine synthethase labeled was highly variable. Scale bar, 20 μm.