
FIGURE 9.
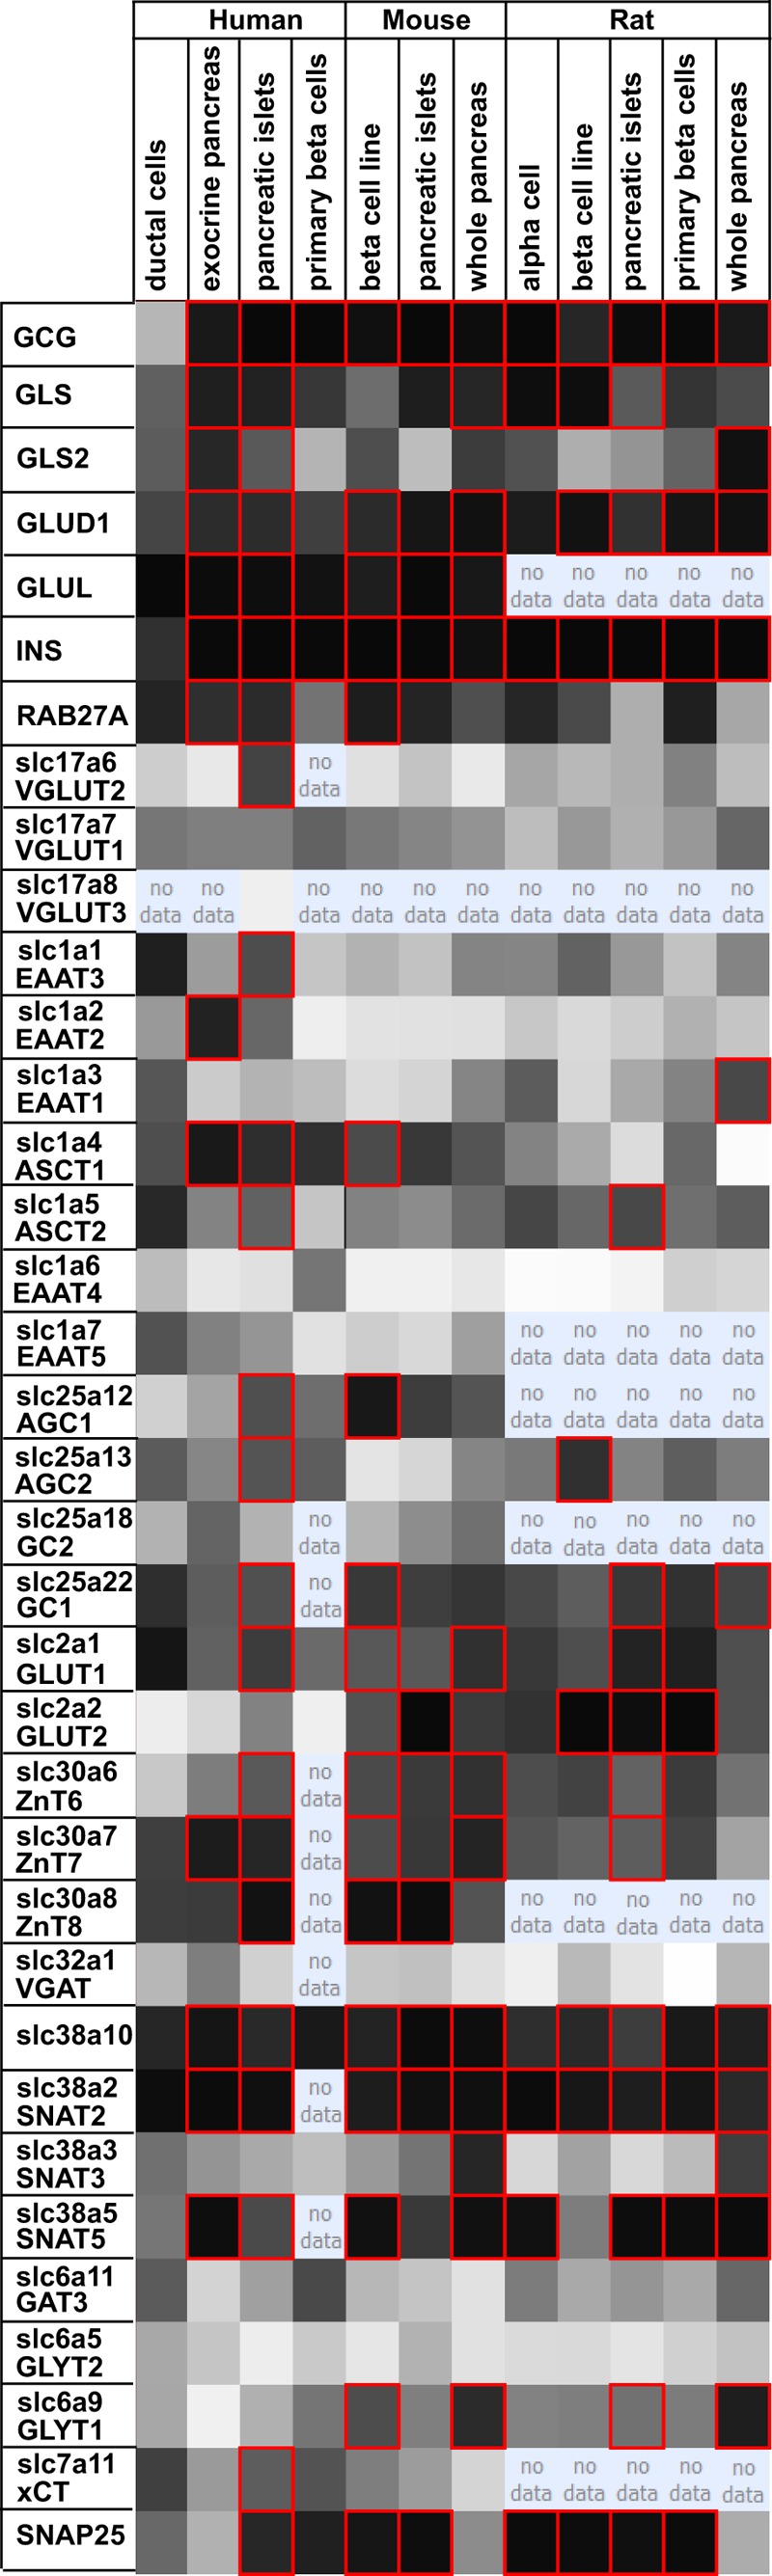
Transcriptome data do not support the notion that glutamate transporters are concentrated in islets. The figure shows a screen shot from the Beta Cell Gene Atlas (90), which contains data on basal expression of genes in different β-cell sources (pancreatic β-cells, islets, whole pancreas, and β-cell lines) from human, mouse, and rat. This database was searched for expression levels of some neurotransmitter transporters previously reported to be enriched in islets and compared with glucose transporters (GLUT1 and GLUT2) and proteins involved in exocytosis (e.g. Rab27) as well as three enzymes involved in glutamate metabolism (GLS, glutaminase; GLUD1, glutamate dehydrogenase; GLUL, glutamine synthetase). Glucagon (gcg) and insulin (INS) are shown for comparison. The latter are expressed at such high levels that they are detected in all samples due to contamination. The darker the cell color, the higher the expression levels. Genes expressed with a probability score of 0.95 or higher are designated with a red border. The column “human pancreatic islet massively parallel signature sequencing” is not shown as it did not contain data on the transcripts that were the focus of this study.