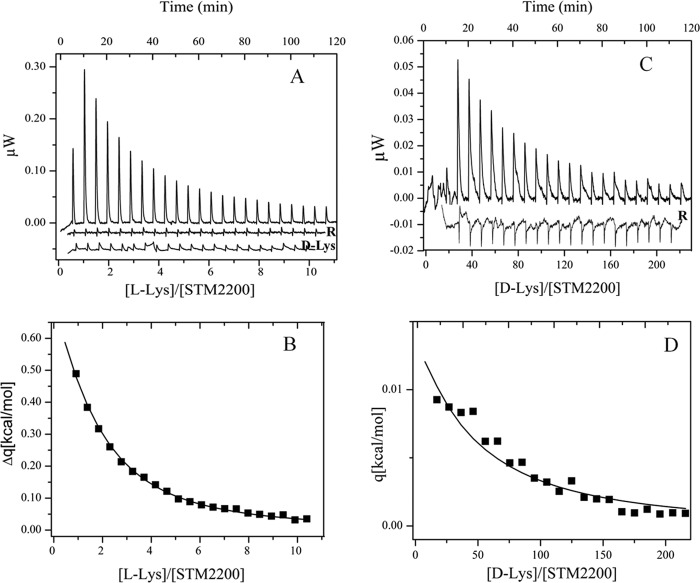
FIGURE 3.
Titration calorimetry of STM2200 at 20 °C. A, l-lysine titration of 30 μm STM2200 in 20 mm MES-NaOH, 0.025% (w/v) β-DDM (buffer B) containing 150 mm NaCl, pH 5.9 with 1 × 4 μl and 22 × 5.0 μl of 5 mm l-lysine in buffer B containing 145 mm NaCl, pH 5.9 and corresponding reference titration (R; shifted by an offset) in the absence of protein. d-Lysine titration of 30 μm STM2200 in buffer B containing 150 mm NaCl, pH 5.9 with 1 × 4 μl and 22 × 5.0 μl of 5 mm d-lysine in buffer B containing 145 mm NaCl, pH 5.9 (d-Lys). B, heat changes (Δq) shown as a concentration ratio between l-lysine and STM2200. Data are presented under “Results,” and mean values are presented in Table 2. C, d-lysine titration of 32 μm STM2200 in buffer B containing 150 mm NaCl, pH 5.9 with 1 × 4 μl and 22 × 5.0 μl of 50 mm d-lysine in buffer B containing 100 mm NaCl, pH 5.9 and corresponding reference titration (R; shifted by an offset) in the absence of protein. D, heat changes (Δq) shown as a concentration ratio between d-lysine and STM2200. Data are presented under “Results,” and mean values are presented in Table 2.

