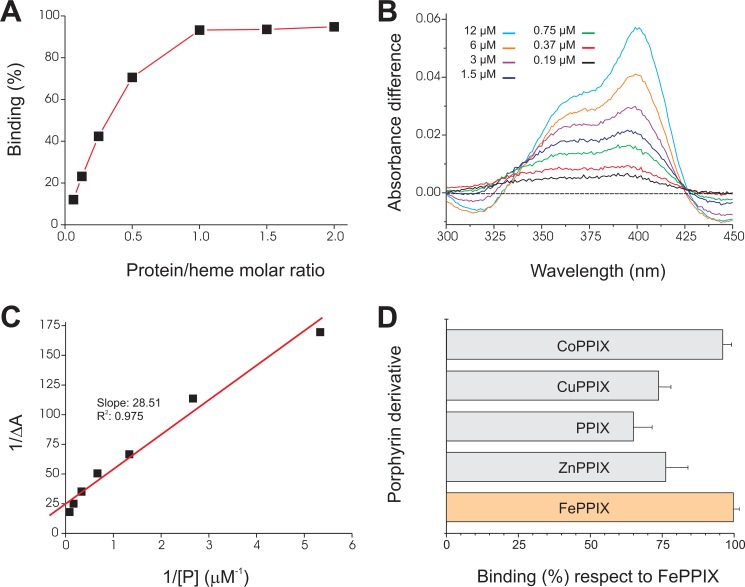
FIGURE 6.
Binding of hemin and other porphyrin derivatives to sMF6p/FhHDM-1. A, hemin (15 μm) was incubated with increasing amounts of sMF6p/FhHDM-1 (1–30 μm) in different tubes, and the resultant complexes were immunoprecipitated with mAb MF6-Sepharose beads. The percentage of bound hemin was determined indirectly by measuring the absorbance (395 nm) of free hemin remaining in the supernatant with respect to a control with hemin alone and was plotted against the protein/heme molar ratio. B, difference absorbance spectra (ΔA, 300–450 nm) for hemin (3 μm) incubated with increasing concentrations of sMF6p/FhHDM-1 (0.19–12 μm) versus hemin alone. C, plot of 1/ΔA at 398 nm against the inverse of protein concentration (1/[P]) fitted by linear regression to calculate the dissociation constant (Kd). D, several metalloporphyrins and PPIX solutions (46 μm) were incubated with the same amount of sMF6p/FhHDM-1-Sepharose beads or with non-conjugated Sepharose beads (as controls), and binding was determined as above. The figure shows the percentage of binding ± S.D. (error bars) for the different porphyrin derivatives relative to hemin (100% binding).

