FIGURE 8.
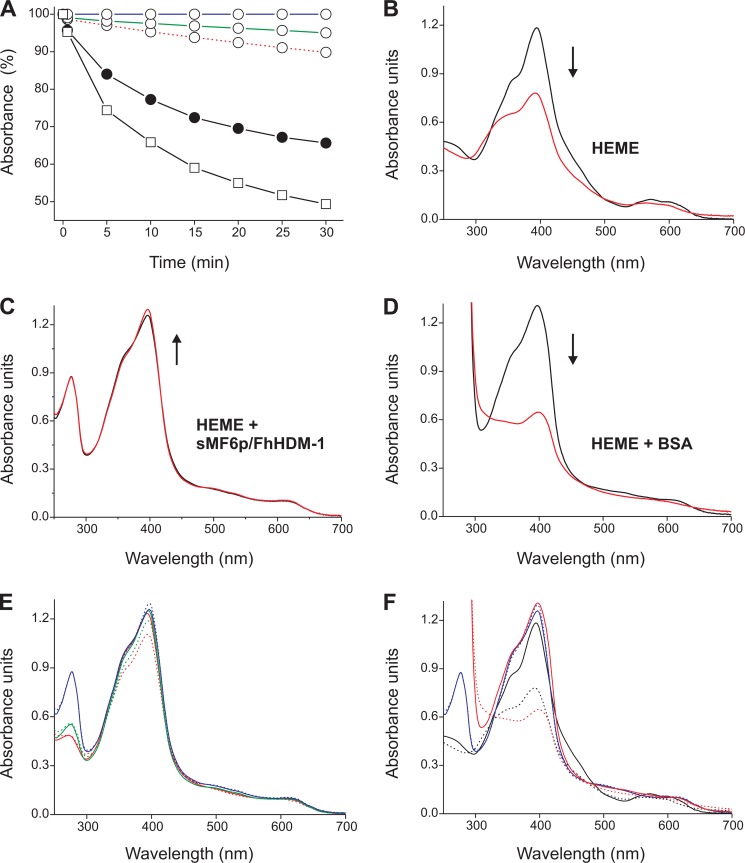
sMF6p/FhHDM-1 protects hemin from degradation by H2O2. A, hemin (23 μm) was incubated with sMF6p/FhHDM-1 (unfilled circles) at protein/hemin molar ratios of 5:1 (solid blue line), 2:1 (solid green line), and 1:1 (dashed red line); BSA at a molar ratio of 5:1 (unfilled squares); or without protein (filled circles), and changes in the absorption spectra (250–700 nm) were monitored before (t = 0) and at several times within 30 min after the addition of 890 μm H2O2. The percentage of the initial absorbance at the Soret peak remaining in each sample after the addition of H2O2 was plotted against time. B–D, absorption spectra at t = 0 (black line) and t = 30 (red line) of hemin alone (B), with sMF6p/FhHDM-1 (C), and with BSA (D) at the 5:1 protein/hemin ratio. The arrows indicate the direction of the change in the absorbance at the Soret band. E and F, comparison of the absorption spectra at t = 0 (solid lines) and t = 30 (dashed lines) for hemin with sMF6p/FhHDM-1 at 5:1 (blue lines), 2:1 (green lines), and 1:1 (red lines) protein/hemin ratios (E) and of hemin alone (black lines) with sMF6p/FhHDM-1 (blue lines) and BSA (red lines) at a 5:1 ratio (F).

