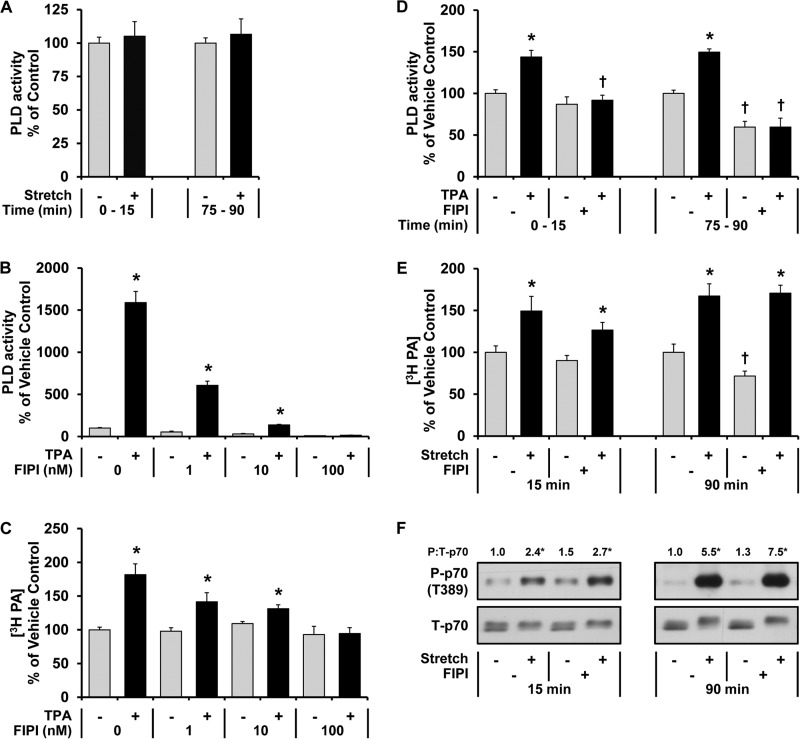
FIGURE 2.
Changes in PLD activity are not required for a mechanically induced increase in PA or mTOR signaling. A, mouse EDL muscles were held at Lo in an ex vivo organ culture system, prelabeled with [3H]myristic acid for 2 h, and then subjected to 15 or 90 min of a stretch (Stretch +) or control condition (Stretch −). PLD activity was measured throughout a 15-min period and expressed as a percentage of the values obtained in the time-matched control samples. B and C, C2C12 myoblasts were prelabeled in serum-free medium containing [3H]myristic acid overnight. After washing with fresh medium, the cells were preincubated with 1, 10, or 100 nm FIPI or the vehicle (FIPI 0, DMSO) for 30 min and then stimulated with 100 nm TPA (TPA +) or the vehicle as a control condition (TPA −, DMSO) for 15 min in the presence (B) or absence (C) of 0.3% 1-butanol. The cells were collected, and PLD activity (B) or the concentration of 3H-labeled PA (C) was measured and expressed as a percentage of the values obtained in the vehicle control samples. The values were obtained from five independent experiments. D--F, mouse EDL muscles were held at Lo in an ex vivo organ culture system and treated as follows. D and E, prelabeled with [3H]myristic acid for 2 h. During the final 30 min of prelabeling, the muscles were incubated with 100 nm FIPI (FIPI +) or the vehicle (FIPI−, DMSO). The muscles were then subjected to 15 or 90 min of stimulation with 1 μm TPA (TPA +) or the vehicle as a control condition (TPA −, DMSO) (D) or subjected to 15 or 90 min of the stretch or control conditions (E). PLD activity (D) or the concentration of 3H-labeled PA (E) was measured and expressed as a percentage of values obtained in the time-matched vehicle control samples. F, preincubated with FIPI or the vehicle as described above and then subjected to 15 or 90 min of the stretch or control conditions followed by Western blot analysis for phosphorylated (P) and total (T) p70. The phosphorylated:total ratios of p70 were expressed relative to the values obtained in the time-matched vehicle control samples. All values are presented as the mean (±S.E. in graphs, n = 3–8 per group). *, significantly different from the time- and drug-matched control group. †, significantly different from the time- and stimulation-matched vehicle group; p ≤ 0.05.

