FIGURE 4.
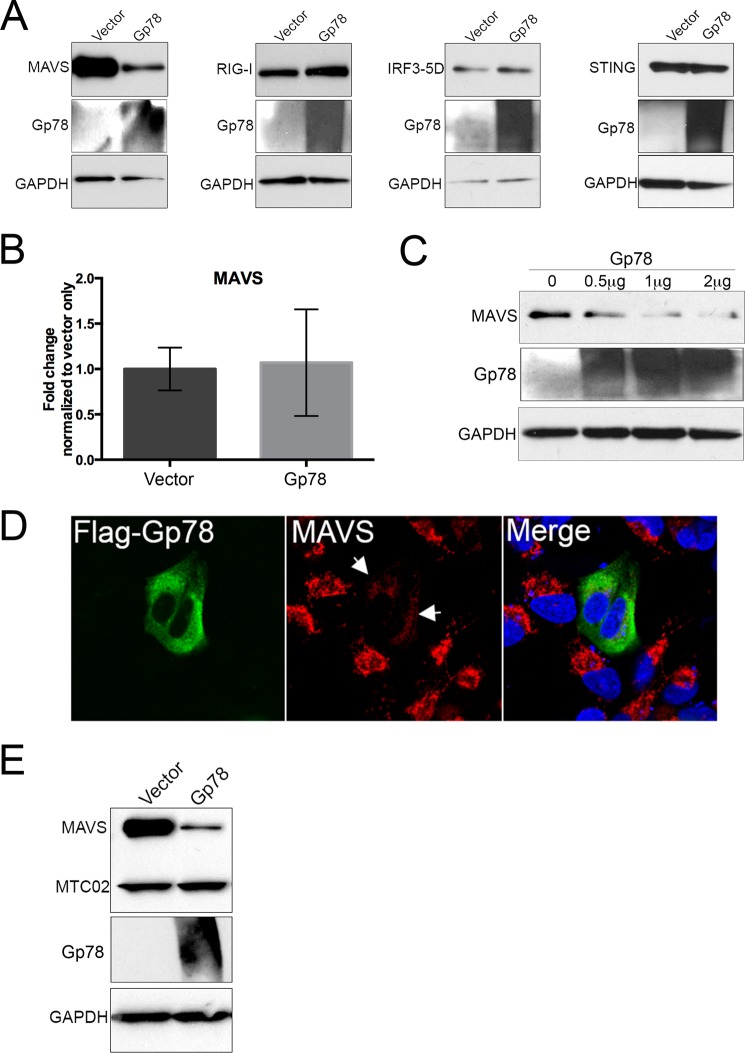
Gp78 specifically alters MAVS levels. A, immunoblot analysis from 293T cells 48 h post-transfection with EGFP-MAVS, EGFP-RIG-I, V5-IRF3–5D, or EGFP-STING and either vector or Gp78. Antibodies directed against GFP or V5 were used. Immunoblotting for Gp78 (middle panel) is included to demonstrate transfection and GAPDH (bottom panels) is included as a loading control. B, levels of MAVS in 293T cells transfected with vector or Gp78 as assessed by RT-qPCR at 48 h post-transfection. C, immunoblot analysis for endogenous MAVS 48 h post-transfection with increasing amounts of Gp78 (from 0 μg to 2 μg). Immunoblotting for Gp78 (middle panel) is included to demonstrate transfection and GAPDH (bottom panels) is included as a loading control. D, immunofluorescence microscopy for endogenous MAVS in U2OS cells 48 h post-transfection with Flag-Gp78. MAVS is shown in red, and Flag-Gp78 is shown in green. DAPI-stained nuclei are shown in blue. White arrows denote areas of decreased MAVS staining in the presence of Gp78. E, immunoblot analysis from 293T cells 48 h post-transfection with EGFP-MAVS and either vector or Gp78. Antibodies directed against GFP and MTCO2 (an unrelated mitochondrial protein) are included as a measure of specificity, and immunoblotting for Gp78 (middle panel) is included to demonstrate transfection and GAPDH (bottom panels). All data are representative of at least three independent experiments, and data in B are presented as mean ± S.D. (*, p < 0.01).

