FIGURE 3.
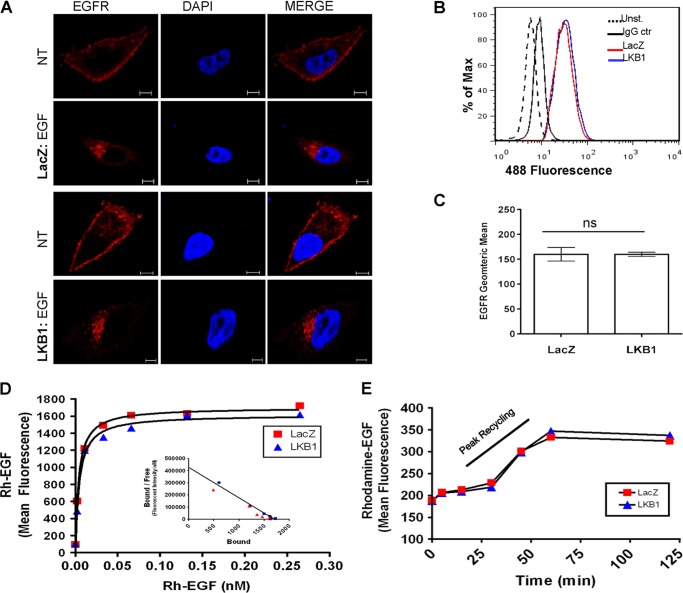
Total EGFR level is not impacted by LKB1. A, representative images from confocal microscopy for total EGFR (red). The nucleus was stained with DAPI (blue). Both LKB1 and LacZ-transfected A549 cells displayed similar distribution of EGFR under non-stimulatory and EGF-stimulated conditions (scale bar, 5 μm). B and C, as measured by flow cytometry, under non-stimulatory conditions, total EGFR expression in LacZ and LKB1-treated cells remained the same (unpaired t test, p = 0.9912). D, Rh-EGF binding of cell surface EGF receptors is similar in LacZ and LKB1-treated cells. Binding curve and Scatchard plot (inset) represent mean fluorescent intensities. Both LacZ and LKB1-treated cells show similar binding curves as well as biochemical parameters (Bmax, 1700 and 1615; Kd, 0.0040 and 0.0045 nm for LacZ and LKB1, respectively). E, binding of Rh-EGF was assessed at various time points after stimulation with unlabeled EGF. LacZ and LKB1-treated cells showed similar recycling kinetics, peaking within 30 to 60 min. NT, no treatment; Unst., unstained; IgG ctr, IgG control.

