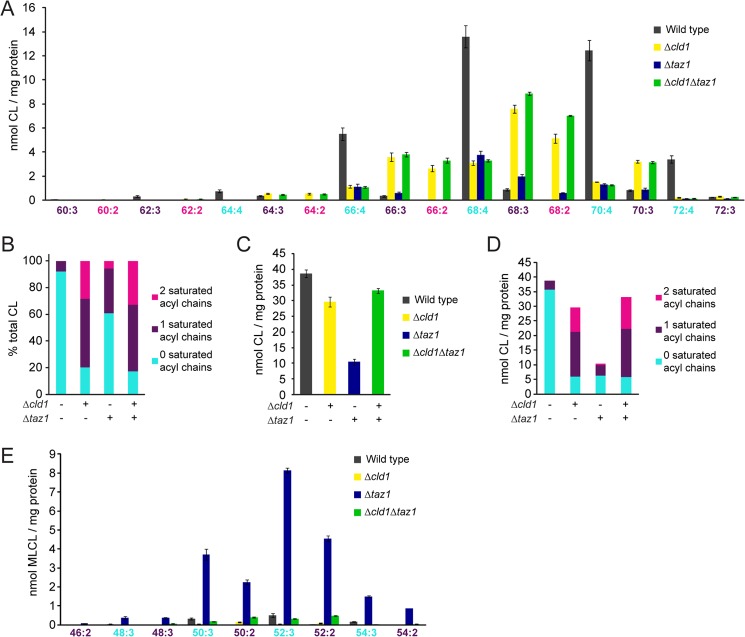
FIGURE 3.
Δcld1 contains unremodeled CL. A, acyl chain composition of CL was determined by multidimensional mass spectrometric array analysis. n = 3. B, CL was categorized by the number of saturated acyl chains and expressed as a % of the total CL. C, quantification of the total amount of CL per mg of protein. D, CL was categorized by the number of saturated acyl chains and expressed as the amount of CL per mg of protein. E, acyl chain composition of MLCL was determined by multidimensional mass spectrometric array analysis. n = 3. Statistical analysis is provided in supplemental Table S1.

