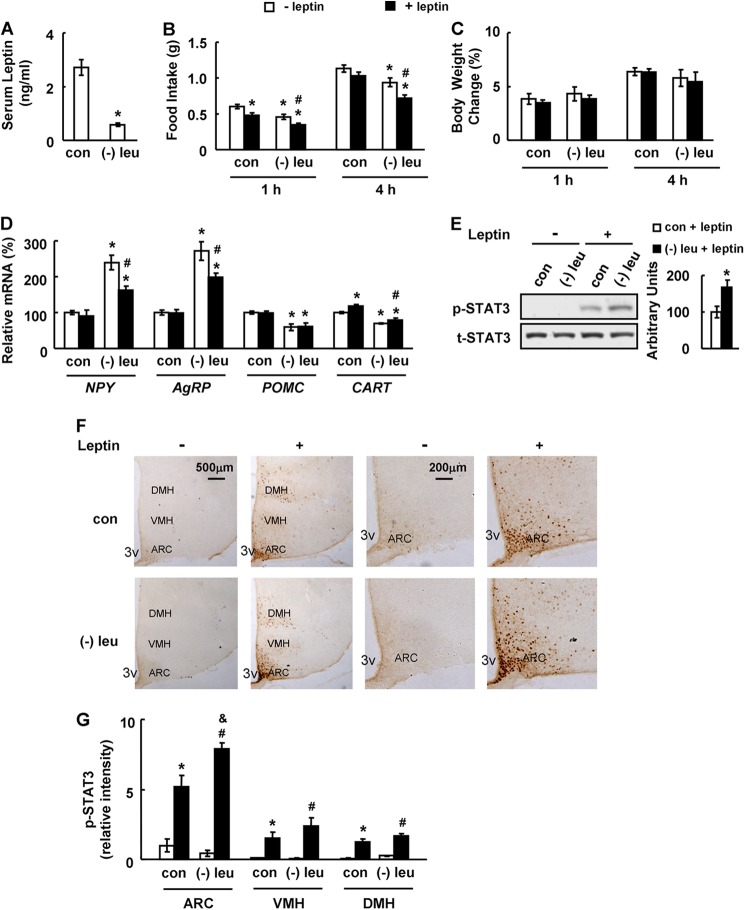
FIGURE 1.
Leucine deprivation increases leptin signaling. Mice were fed a control (con) or leucine-deficient ((−)leu) diet for 7 days, followed by measuring serum leptin levels in A; mice were fasted for 24 h prior to intraperitoneally injecting PBS (− leptin) or 3 mg/kg leptin (+ leptin). This was followed by measuring food intake and body weight 1 and 4 h post-injection in B and C or analyzing STAT3 phosphorylation 45 min post-injection in E and F, or mice were fasted for 24 h prior to i.p. injecting PBS (− leptin) or 2 mg/kg leptin (+ leptin), followed by analyzing levels of mRNA 45 min post-injection in D. Data are mean ± S.E. (n = 5–6 for each group in A–E; n = 3 or 4 in F and G). Statistical significance was determined by Student's t test. *, p < 0.05 for the effect of (−)leu versus control diet for A and E, or by ANOVA followed by the SNK test. *, p < 0.05 for the effect of any group versus PBS treated-control mice. #, p < 0.05 for the effect of leptin-treated (−)leu group versus PBS-treated (−)leu group. &, p < 0.05 for the effect of leptin-treated (−)leu group versus leptin-treated control group for B–D and G. A, serum leptin levels; B, food intake; C, body weight change; D, hypothalamic neuropeptide changes; E, hypothalamic STAT3 proteins (upper panel, Western blot; lower panel, quantitative measurements of p-STAT3 protein relative to total STAT3); F, immunohistochemistry staining for p-STAT3 in hypothalamus. 3V, third ventricle. Images shown are representative of several animals for each group. Scale bar, 500 and 200 μm. G, quantitation of the intensities of positive p-STAT3 signals within the ARC, VMH, and DMH regions as marked in F. Relative signal intensities are quantified using Image-Pro Plus software from sections at Bregma −1.34 to −2.06 mm for each indicated treatment group.

