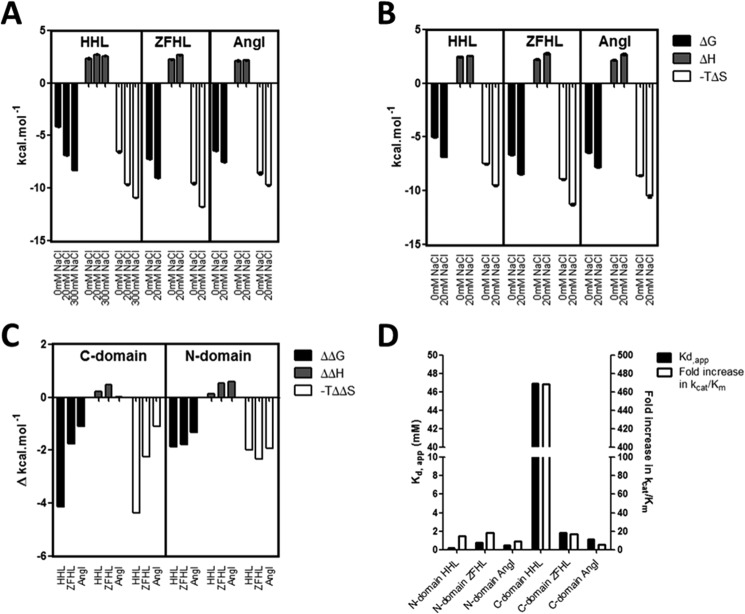
FIGURE 4.
Effect of chloride concentration on thermodynamic parameters associated with ACE hydrolysis. Shown is the thermodynamic signature for the hydrolysis of HHL, Z-FHL, and angiotensin I at 0 and 20 mm NaCl by the C-domain (A) and N-domain (B). The values for the C-domain with HHL at 300 mm NaCl are included because this is the concentration of maximal activity and chloride saturation for this substrate and domain (whereas 20 mm is the maximum for the other values). C, the ΔΔG, ΔΔH, and −TΔΔS values for the C-domain and N-domain represent the difference in ΔG, ΔH, and −TΔS between 0 and 20 mm (between 0 and 300 mm for HHL with the C-domain). D, relative Kd(app) values (left y axis) and -fold increase in kcat/Km from 0 mm to maximal activity (right y axis) for C- and N-domains with HHL, Z-FHL, and AngI. Error bars, S.E.

