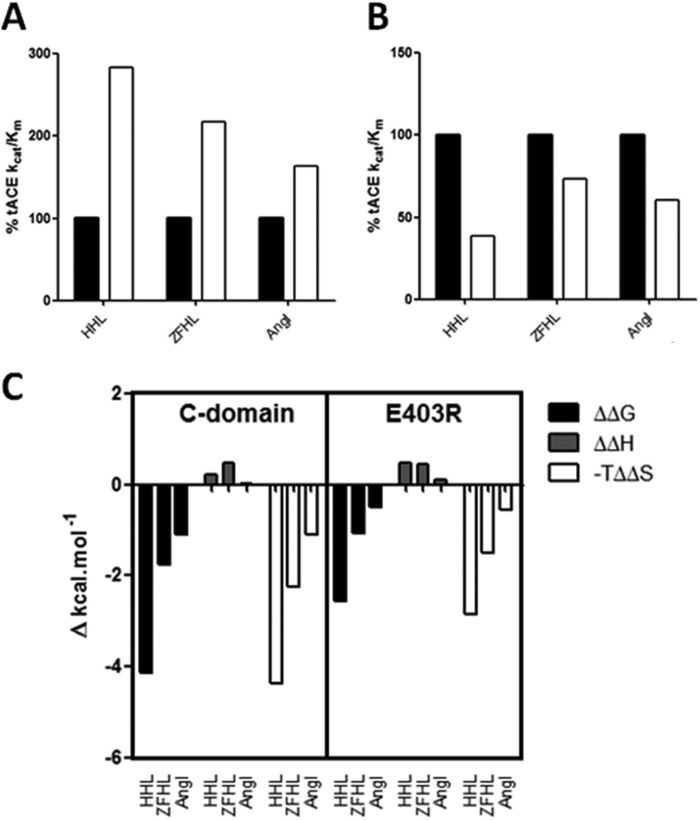
FIGURE 8.
Trends in chloride binding and activity for E403R. Shown is a graphical representation of kcat/Km kinetic values obtained for the C-domain (black bars) and E403R (white bars) with HHL, Z-FHL, and AngI as substrates. The kcat/Km value was taken as the percentage of the kcat/Km for the C-domain at 0 mm (A) and 20 mm (B) NaCl. C, change in thermodynamic parameters for E403R. The ΔΔG, ΔΔH, and −TΔΔS values for the C-domain and E403R are shown and represent the difference in ΔG, ΔH, and −TΔS between 0 and 20 mm NaCl (0 and 300 mm for HHL with C-domain).

