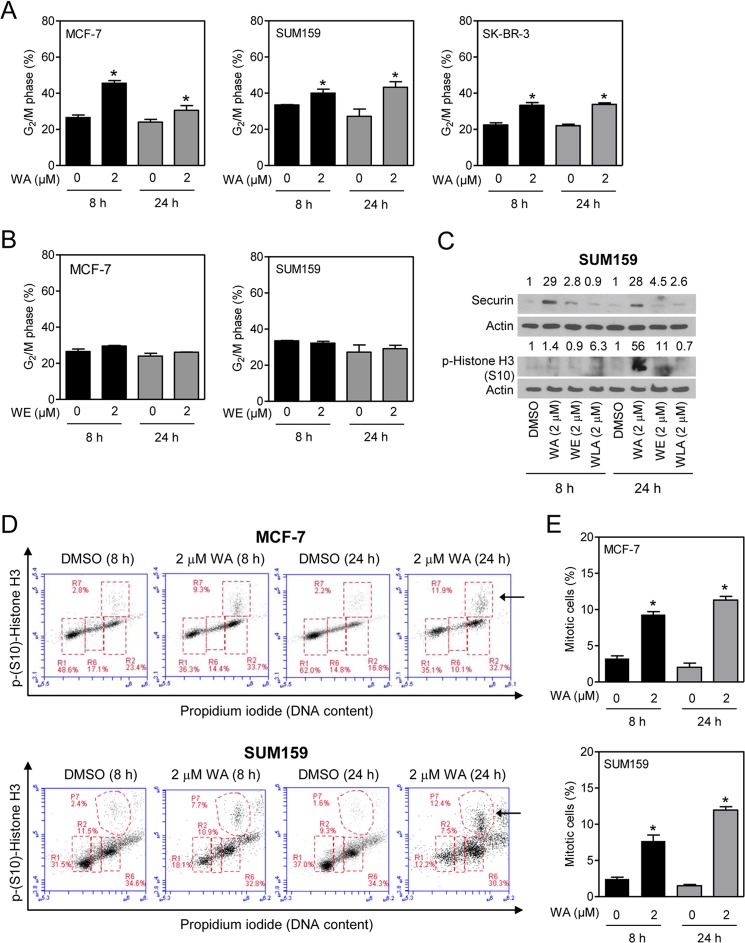
FIGURE 2.
WA treatment results in G2 and mitotic arrest in human breast cancer cells. A, effect of WA (8- or 24-h treatment) on G2-M fractions in MCF-7, SUM159, and SK-BR-3 cells. B, effect of WE (8- or 24-h treatment) on G2-M fractions in MCF-7 and SUM159 cells. C, Western blot analysis of securin and phospho-Ser10 histone H3 using lysates from SUM159 cells treated for 8 or 24 h with DMSO (control) or WA, WE, or WLA (2 μm). The numbers on top of the bands represent changes in protein levels relative to the DMSO-treated control. D, representative flow histograms depicting mitotic fractions (identified by the arrows) from MCF-7 and SUM159 cells after a 8- or 24-h treatment with DMSO or 2 μm WA. E, quantitation of mitotic fractions in MCF-7 and SUM159 cells from the data shown in D. Results shown are means ± S.D. (n = 2–3). *, statistically significant (p < 0.05) compared with the DMSO control by Student's t test. Each experiment was repeated twice, and the results were comparable.

