Figure 3.
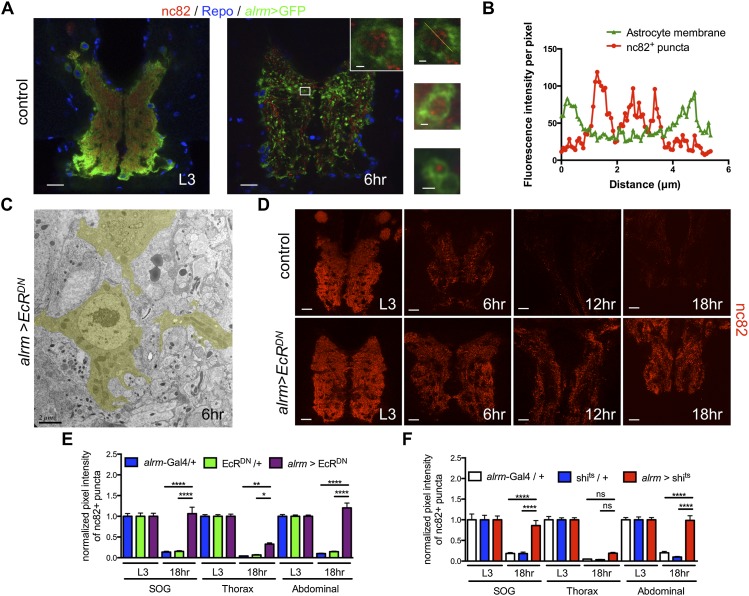
Astrocytes engulf and clear synaptic material from the neuropil. (A) In A and D, confocal images are single z-confocal slices. Astrocytes were labeled with GFP (alrm-Gal4, UAS-mCD8∷GFP/+; green), glial nuclei were labeled with anti-Repo (blue), and, in A and D, active zones were labeled with nc82 (antibody for Brp; red). Time points are as follows: L3 (third instar larva) and APF (hours APF). (Top inset) High-magnification view of the boxed region. (Middle and bottom insets) Other examples of vacuoles. Bars: 20 μm; insets, 1 μm. (B) The graph shows fluorescence intensity per pixel in each channel for the inset in A of the astrocyte membrane and nc82+ puncta along a line drawn through a vacuole. (C) TEM image from a cross-section of the abdominal VNC of an alrm>EcRDN animal. An astrocyte (outlined in yellow) at the edge of the neuropil. Time point is as indicated (APF). Genotype used was as follows: alrm>EcRDN (alrm-Gal4,UAS-mCD8∷GFP/UAS-EcRDN). Bars, 2 μm. (D) Time points are as indicated (APF). Genotypes used were as follows: control (alrm-Gal4/+) and alrm>EcRDN (alrm-Gal4/UAS-EcRDN). Bars, 20 μm. (E,F) Quantification of pixel intensity of nc82+ puncta at L3 and 18 h APF in SOG, thorax, and abdominal regions of the VNC. (E) Genotypes used were as follows: EcRDN/+ (UAS-EcRDN/+) and alrm>EcRDN (alrm-Gal4/UAS-EcRDN). Error bars represent ±SEM. N-values are as follows: alrm-Gal4/+, N ≥ 20; UAS-EcRDN/+, N ≥ 16; and alrm-Gal4/UAS-EcRDN, N ≥ 20 (N denotes number of measurements). (*) P < 0.05; (**) P < 0.01; (****) P < 0.0001. (F) Genotypes used were as follows: shits/+ (UAS-shits/+) and alrm>shits (alrm-Gal4/UAS-shits). Flies were raised at 18°C and then shifted to the restrictive temperature (30°C) at 0 h APF for 18 h. Error bars represent ±SEM; N ≥ 12; (****) P < 0.0001.

