Figure 6.
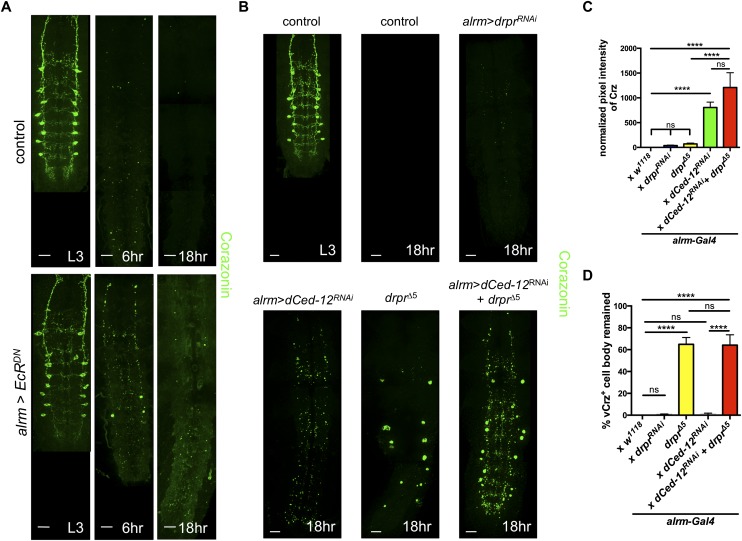
EcR, Draper, and Crk/Mbc/dCed-12 function in astrocytes to promote clearance of vCrz+ neuronal debris. (A) vCrz+ neurons were labeled with anti-Crz (green) in A and B. Time points used were as follows: L3 (third instar larva). Genotypes used were as follows: control (alrm-Gal4, UAS-mCD8∷GFP/+) and alrm>EcRDN (alrm-Gal4, UAS-mCD8∷GFP/UAS-EcRDN). Confocal images in A and B are z-projection images. Bars, 20 μm. (B) Time points are as indicated in A. Bars, 20 μm. Genotypes used were as follows: control (alrm-Gal4/+), alrm>drprRNAi (alrm-Gal4/drprRNAi), drprΔ5 (alrm-Gal4/+; drprΔ5), alrm>dCed-12RNAi (alrm-Gal4/dCed-12RNAi), and alrm>dCed-12RNAi+drprΔ5 (alrm-Gal4/dCed-12RNAi; drprΔ5). (C) Quantification of pixel intensity of vCrz+ debris from B. (C,D) N-values are as follows: alrm-Gal4/+, N = 32; alrm-Gal4/drprRNAi, N = 11; alrm-Gal4/+; drprΔ5, N = 11; alrm-Gal4/dCed-12RNAi, N = 14; and alrm-Gal4/dCed-12RNAi; drprΔ5, N = 12 brains quantified. Error bars represent ±SEM. (****) P < 0.0001. (D) Quantification of the percentage of remaining vCrz+ cell bodies from B. Error bars represent ±SEM. (****) P < 0.0001.

