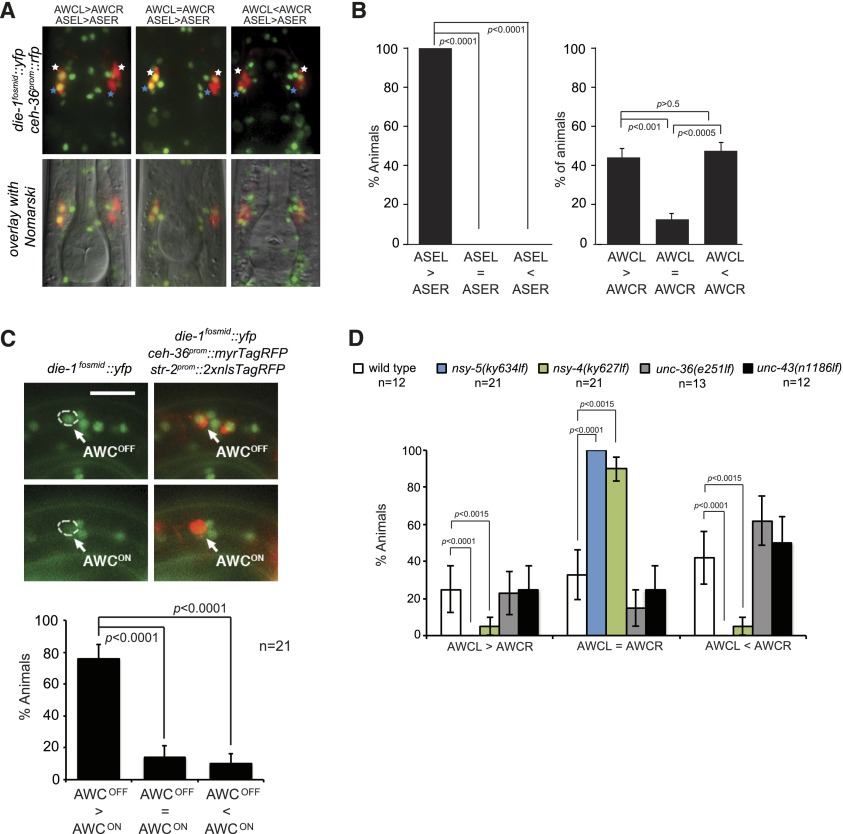
Figure 4.
Antisymmetric expression of die-1 in the AWC neurons. (A) Representative images of die-1fosmid∷ 2xFlag∷Venus for animals showing asymmetric expression in AWC and ASE neurons labeled by expression of ceh-36 promTagRFP. Images were derived by Z-projections of stacks with focal planes showing die-1fosmid∷ 2xFlag∷Venus signals. White stars indicate AWCs, and blue stars indicate ASE neurons. (B) Quantification of die-1 asymmetry in AWC and ASE neurons. Acquired image stacks of die-1fosmid∷2xFlag∷Venus, ceh-36prom∷TagRFP (otIs264)-expressing animals were analyzed for expression in left or right AWC and ASE neurons. P-values were calculated using a Z-test. Error bars represent standard error of proportion. n = 45 for both quantifications. (C) die-1 is expressed in AWCOFF. Representative images of die-1fosmid∷yfp (vyEx1506), ceh-36prom∷myrTagRFP(vyEx792), and str-2prom∷2xnlsTagRFP(vyIs51) in a first stage larva. (Top panels) The AWCOFF cell was defined as str-2prom∷2xnlsTagRFP-negative and ceh-36prom∷myrTagRFP-positive. (Bottom panels) The AWCON cell was identified as str-2prom∷2xnlsTagRFP-positive nuclei and ceh-36prom∷myrTagRFP-positive. Bar, 10 μm. (Bottom graph) To quantify die-1fosmid∷yfp expression in AWCON and AWCOFF cells, the single focal plane with the brightest fluorescence in each AWC was selected from the acquired image stack and measured for fluorescence intensity. Each animal was categorized into one of three categories (AWCOFF > AWCON, AWCON = AWCOFF, and AWCOFF < AWCON) based on the comparison of YFP intensities between AWCON and AWCOFF cells of the same animal. P-values were calculated using a Z-test. Error bars represent standard error of proportion. (D) Antisymmetric die-1 expression, assayed with die-1fosmid∷yfp (otIs274), in AWCL/R is regulated by a nsy-5-dependent gap junction neural network but is independent of the calcium-triggered MAPK pathway. First larval stage animals were scored. P-values were calculated using Fisher's exact test. Error bars represent standard error of proportion.

