Figure 2.
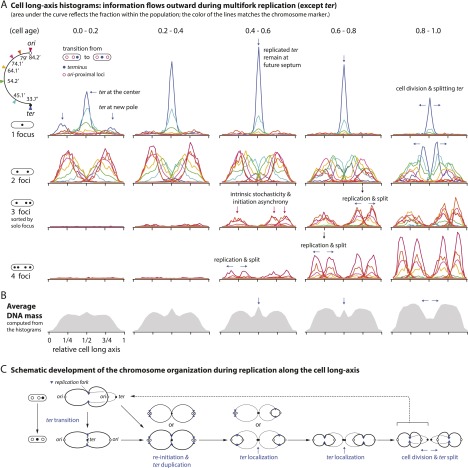
Cell long axis histograms show outward information flow during multifork replication. (A) The histograms are grouped based on the number of foci of the locus and the age of the cell (throughout this study, the color of the lines matches the chromosome marker in Fig. 1B). The area below each distribution reflects the fraction of the group of cells within the population. Notice that the terminus is localized at the cell center until it splits into two, except in some new cells (e.g., age 0.0–0.2). Peaks of other distributions also split into two after replication and drift away from each other (indicated by arrows). The significant fraction of the three-foci cells implies significant stochasticity of initiation of replication; ∼20% (∼10 min) of the 55-min generation time (see the Materials and Methods). Except for the three-foci cells, the cells are randomly oriented, and the histograms are symmetric (see Supplemental Fig. 1 for unsorted three-foci histograms). (B) The population average of DNA distribution within the age group can be obtained by summing up the weighted histograms in A (see the Materials and Methods). (C) Schematic development of the chromosome organization during replication along the cell long axis. This summarizes the natural flow of structural development of the replicating chromosome seen in the histograms in A.

