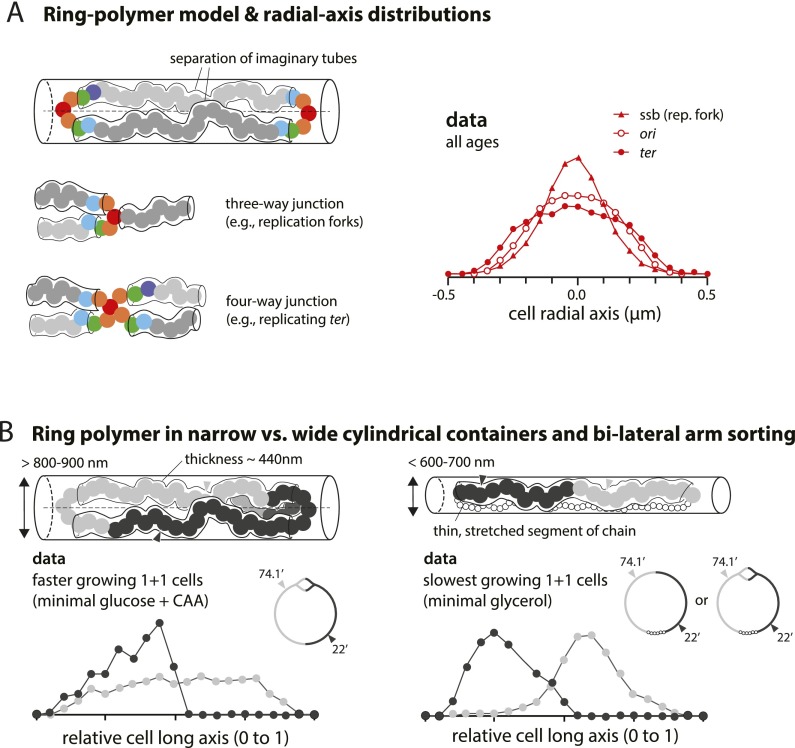
Figure 6.
The ring polymer model of the bacterial chromosome. (A) The arms of the polymer can be interpreted as two imaginary tubes confined in each half along the radial axis. The tubes meet at the ori region and result in a single-peak distribution, as depicted in the floating model in Figure 5B. Similar principles apply to more complex topologies. For instance, replication forks can be considered as a three-way junction, and the terminus can be considered as a four-way junction. Their radial axis histograms show a single peak. In contrast, loci in the separated arms show double peaks (Supplemental Fig. 3). (B) A ring polymer in narrow versus wide cylindrical containers. The diameter of E. coli varies in response to changes in growth rate (<600–700 nm in slow-growing conditions and >800–900 nm in faster-growing conditions) (Trueba and Woldringh 1980). The principles illustrated in A are valid when the cylinder is sufficiently wide to accommodate two imaginary tubes (diameter 440 nm) (Pelletier et al. 2012). As the cylinder becomes narrower and only one tube can fit, the global orientation of the polymer should be understood as that of a linear polymer in a cylinder (Jun and Wright 2010). This can explain the conformation of the E. coli chromosome in all growth conditions and the major difference of the chromosome conformation between slow- and fast-growing cells seen in the data.

