
Figure 6.
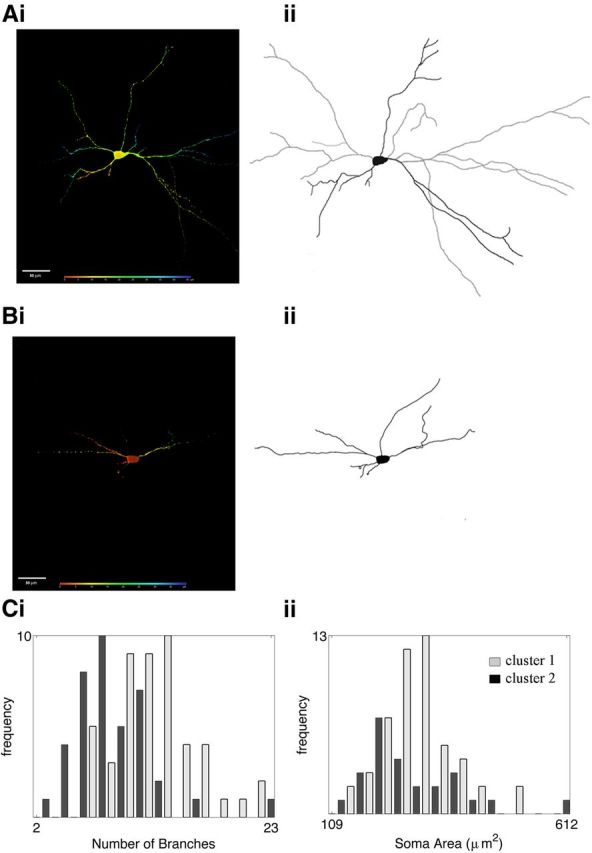
The morphological properties of dorsal and ventral V3 clusters. Ai, Bi, Confocal images of representative V3 INs from clusters 1 (Ai) and 2 (Bi). Colors reflect the depth of the image from the surface (red) to deep into the section (blue). Aii, Bii, Reconstruction of corresponding cells in Ai and Bi. Ci, Distribution histogram of primary branches of cells in clusters 1 (light gray) and 2 (dark gray). Cii, Distribution histogram of soma areas of cells in clusters 1 (light gray) and 2 (dark gray).