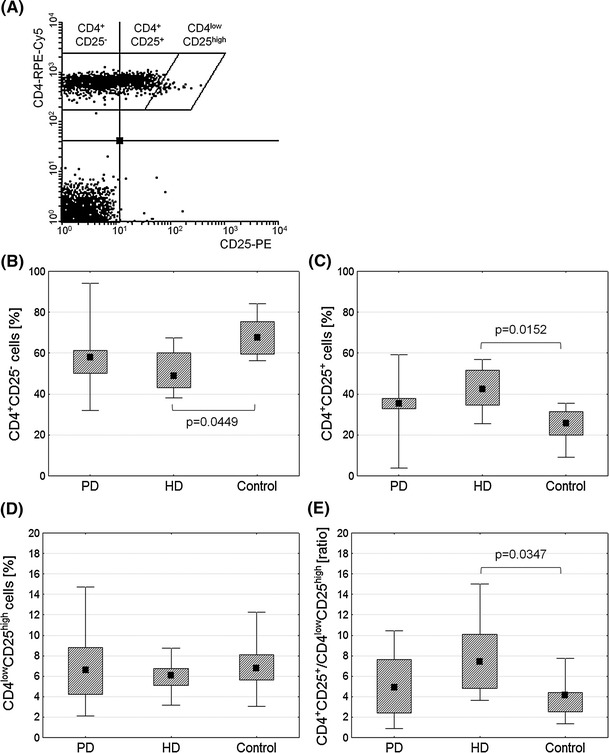
Fig. 1.

Comparison of activated and regulatory T cells within the CD4+ population ex vivo. T regulatory cells were identified based on low expression of CD4 simultaneous with high expression of CD25 (a) as described by Bryl et al. [12]. Graphs demonstrate percentages of CD4+CD25− (b), CD4+CD25+ (c), CD4lowCD25high cells (d), and CD4+CD25+/CD4lowCD25high ratio (e) in predialysis (PD) and hemodialyzed (HD) patients and healthy controls. Midpoints of figures represent medians, boxes represent 25–75 % and whiskers outside represent the minimum and maximum of all the data, Kruskal–Wallis and post hoc test, p < 0.05
