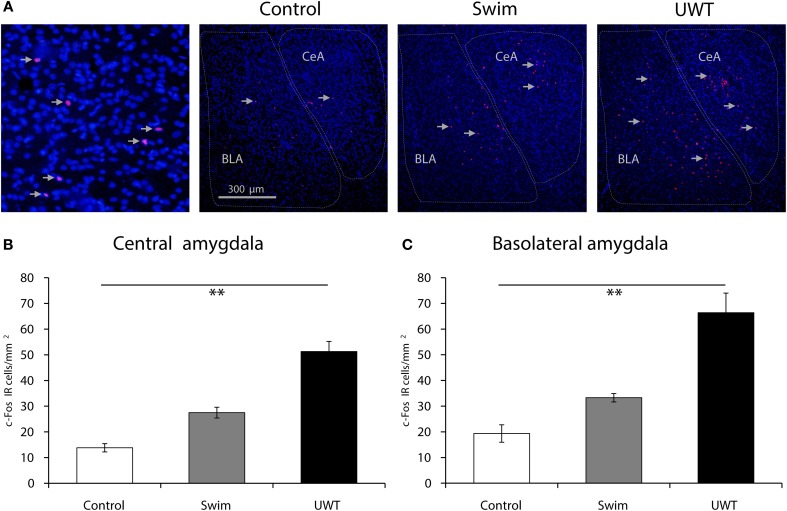
Figure 4.
c-Fos expression 90 min after the WAZM test on the 30th day. (A) Representative images of c-Fos-IR (red) and DAPI (blue) in the central amygdala (CeA) and basolateral amygdala (BLA). All groups' c-Fos expression differed significantly in the CeA (B) and BLA (C). All bars represent the mean ± s.e.m. **p < 0.01.

