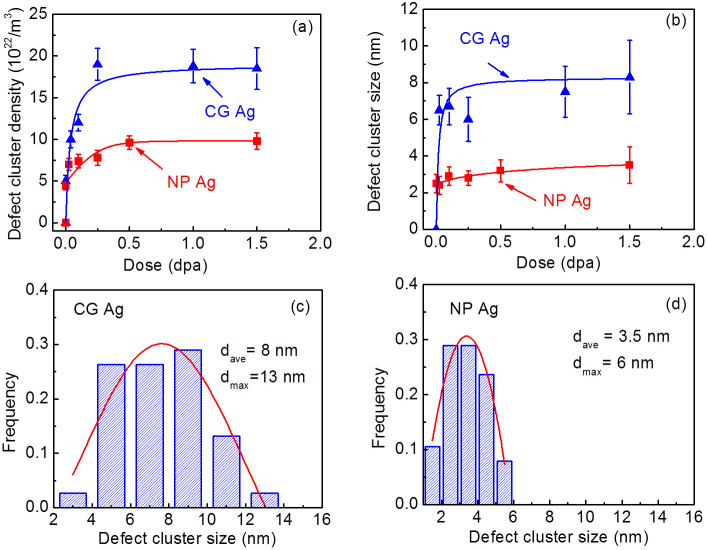
Figure 2. Statistics of density and size of defect clusters reveals superior radiation tolerance of NP Ag.
(a) The density of defect clusters in NP Ag increased gradually with dose (fluence) to a saturation density of 1 × 10²³/m3 at 0.5 dpa, whereas cluster density in CG Ag increased drastically and saturated by 0.25 dpa at twice higher value, 2 × 10²³/m3. (b) At increasing dose, the average size of defect clusters in CG Ag increased monotonically to ~8 nm, whereas the defect cluster size in NP Ag remained small, ~3.5 nm by 0.5 dpa. (c–d) Statistical size distributions of defect clusters (by 1.5 dpa) show that CG Ag has both greater average and maximum defect size, ~8 and 13 nm respectively, comparing to 3.5 nm and 6 nm in irradiated NP Ag.

