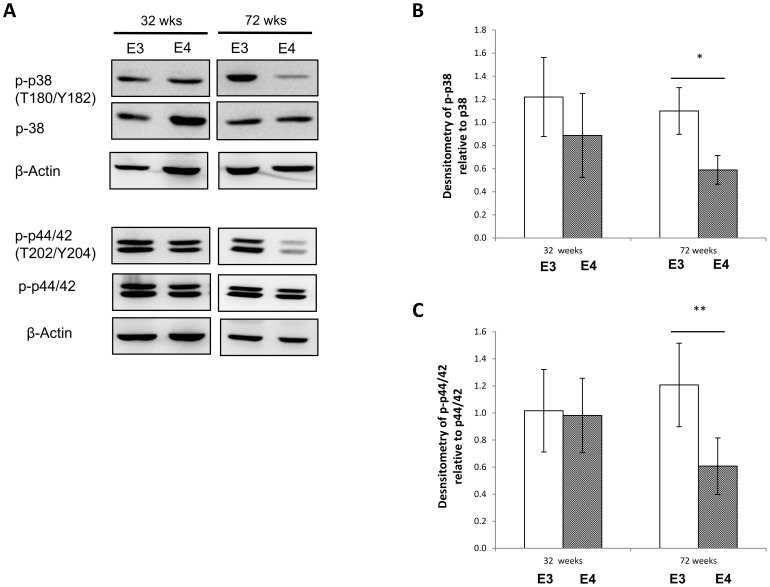
Figure 2. MAPK expression and phosphorylation in huApoE TR mice.
(A) Immunoblotting of total p38 and p44/42, phosphorylated p38 (T180/Y182) and phosphorylated p44/42 (T202/Y204) in huApoE3 and huApoE4 TR mice at 32 and 72 weeks of age. β-actin was immunoblotted to ensure similar gel loading of the starting material in each sample. The blot is a representative of three independent experiments. Blot images were cropped for comparison. Densitometry analysis of (B) phosphorylated p38(T180/Y182) level relative to total p38 and (D) phosphorylated p44/42(T202/Y204) level relative to total p44/42 level, in 32 and 72 weeks old E3 (white bar) and E4 (grey bar) mice was performed using the NIH ImageJ software. Each value represents the mean ± SEM for individual mouse brain sample (n = 3 at each time point for each mouse line). Lower p38 phosphorylation (T180/Y182) and p44/42 phosphorylated (T202/Y204) was detected in 72 weeks E4 TR mice as compared to E3 TR mice at similar age. (*p < 0.005; ** p < 0.02, using Student's t-test).

