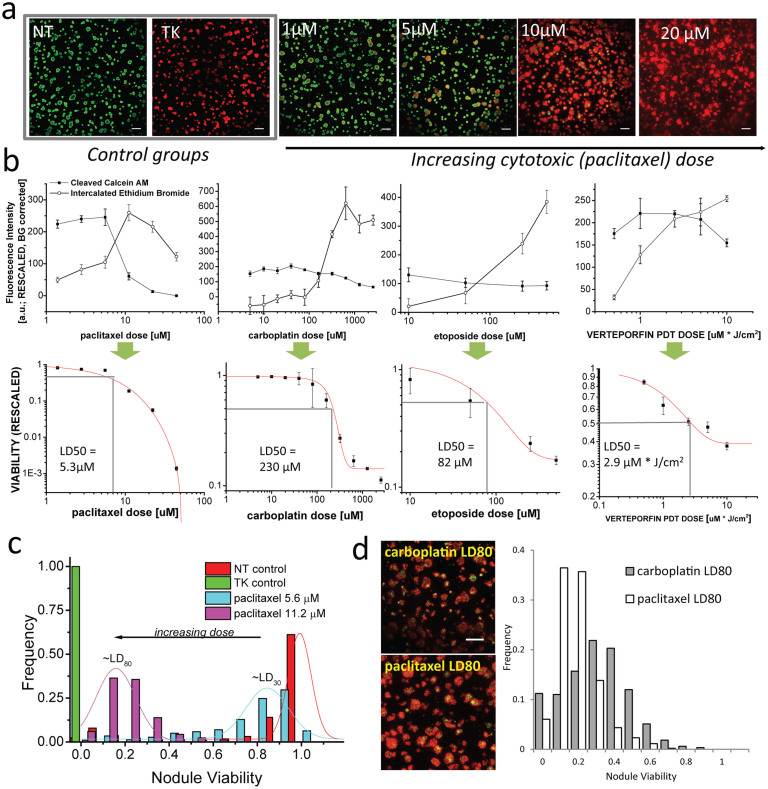
Figure 2. A viability metric reports overall dose response and heterogeneity based on relative esterase activity and membrane permeability.
In (a), representative thumbnails from merged images of esterase-cleaved calcein AM (green) and intercalated ethidium bromide (red) in ovarian cancer 3D overlays for (left to right), no treatment (NT) and total killing (TK) and increasing doses of paclitaxel (as a representative cytotoxic agent). Thumbnails qualitatively display increasing ethidium bromide intercalation (red) and decreasing esterase activity (green) with increasing cytotoxic dose similar for all therapies assayed here. Scale bars = 500 μm. In (b), mean fluorescence signals from full fields after rescaling (Equation 1) are shown for escalating doses of paclitaxel, carboplatin, etoposide, and verteporfin PDT treatments (from left to right) in the upper plots used to quantify overall viability (lower plots, from Equation 2) and estimate fractional lethal doses (LD). In (c), distributions of nodule viabilities (N > 1000) from automated segmentation (shown for paclitaxel-treated cultures) shifts to the left as expected with increasing dose. In (d), paclitaxel and carboplatin viability distributions at LD80 (thumbnails, left, scalebars = 500 μm) are juxtaposed to reveal a relatively tight distribution in the former in contrast to heterogeneous viability spectrum in the latter with sub-populations up to 80–90% viable.

