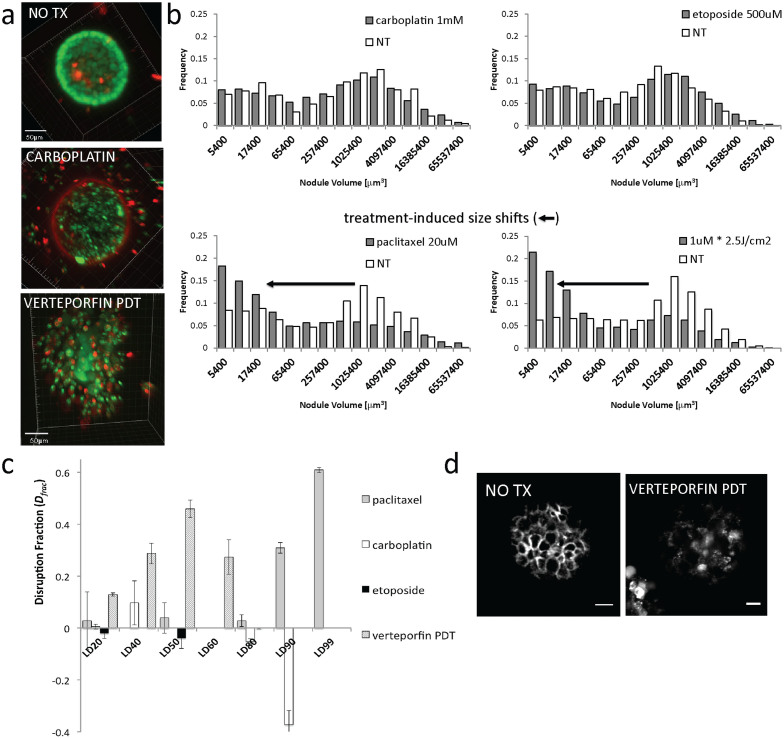
Figure 4. Contrasting quantitative reporters of cytotoxic and structural response.
In (a) high-resolution 3D confocal renderings of single nodules from no treatment, carboplatin and verteporfin-PDT are shown from top to bottom to provide qualitative assessment of contrasting patterns of cytotoxic response. Scale bars = 50 μm. In (b), log-normal bi-modal nodule volume distributions show contrasting patterns between with little evidence of disruption (upper plots, given doses of etoposide and carboplatin) and treatments which with appropriate dosage appear to have a propensity to “unpack” multicellular nodules (lower plots, paclitaxel and PDT). Each histogram contains statistics on 1,000–3,000 micronodules. In the latter category there is a shift in the bimodal size distribution from the proportion of nodules in the mode corresponding to larger sizes to smaller sizes consistent with larger nodules being induced to disaggregate into an increased number of small nodules. In (c), disruption fraction, (Dfrac) based on the treatment-induced shifts in size from (B), is reported with respect to the degree of lethality for several dose for each treatment tested. Error bars show standard error. Verteporfin-PDT induces high Dfrac at low lethality while carboplatin and etoposide treatments suppresses viability at very high doses with negligible architectural disruption. Paclitaxel also unpacks nodules but requires higher level of cell killing in order to do so. In (d), immunofluorescence images show a clear contrast between strong E-cadherin staining at cadherens junctions in untreated nodules, with disrupted and punctate intracellular staining in PDT-treated nodules, consistent with the observation of cellular disassociation.

