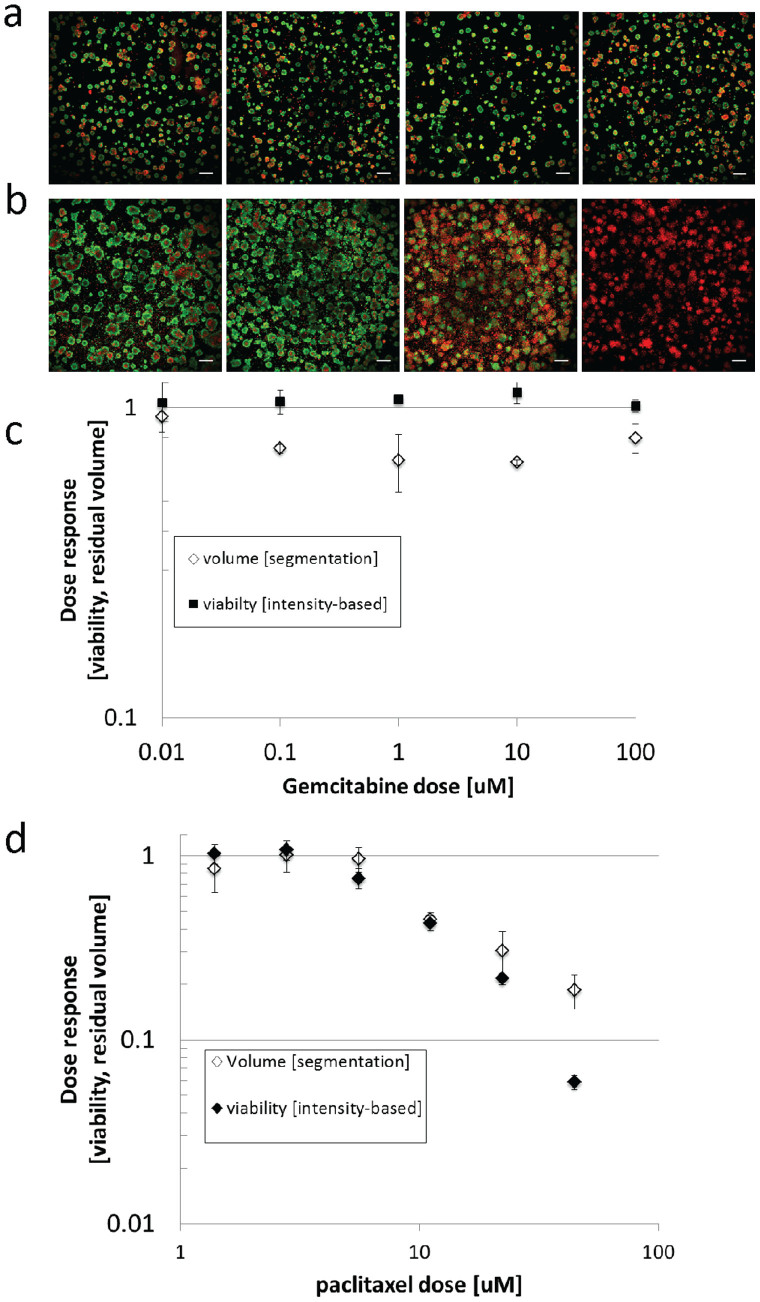
Figure 5. Analysis of contrasting growth inhibitory and cytotoxic responses in a 3D pancreatic tumour model.
(a): Representative thumbnails from merged fluorescent images of cleaved calcein AM (green) and intercalated ethidium bromide (red) for pancreatic 3D cultures treated with (from left to right) untreated, 0.01, 1.0 and 100 μM gemcitabine doses showing minimal evidence of cell death (ethidium bromide staining). (b): Analogous thumbnails for identical pancreatic 3D cultures (left to right) untreated, or treated with 2.78, 11.1 or 44.5 μM paclitaxel dosage. In (c), estimation of tumour volumes reports a modest growth inhibition (~20%) from gemcitabine treatment which is not detected by the intensity-based viability metric. In (d), a strong cytotoxic response to paclitaxel is reported by both metrics, with some disagreement from at doses nearing 90% killing due to error in segmentation of weak calcein signals in those treated cultures.

