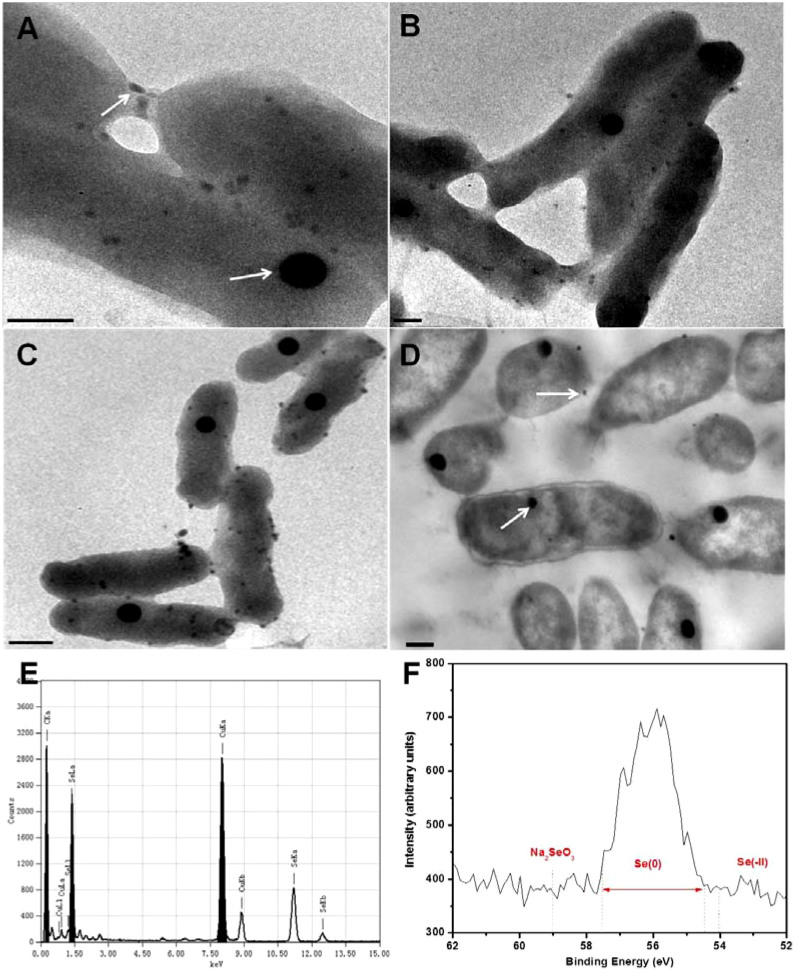
Figure 5. Observation of the synthesized Se(0).
TEM images of the unstained S. oneidensis MR-1 cells showing the subcellular localization of Se deposition in the cells. Selenite-reducing cells at 6 h (A); 12 h (B); 24 h (C); and thin sections of cells at 12 h (D) are given. Arrows denote Se(0) particles. Scale bar: 200 nm; (E) Typical EDX analysis of the particles in (A). Both types of nanoparticles at different points were analyzed and the results were consistent; and (F) High-resolution Se 3d XPS of cells after Se(0) deposited (48 h). The energy positions/ranges of Na2SeO3, Se(0), as well as typical inorganic selenides were marked.

