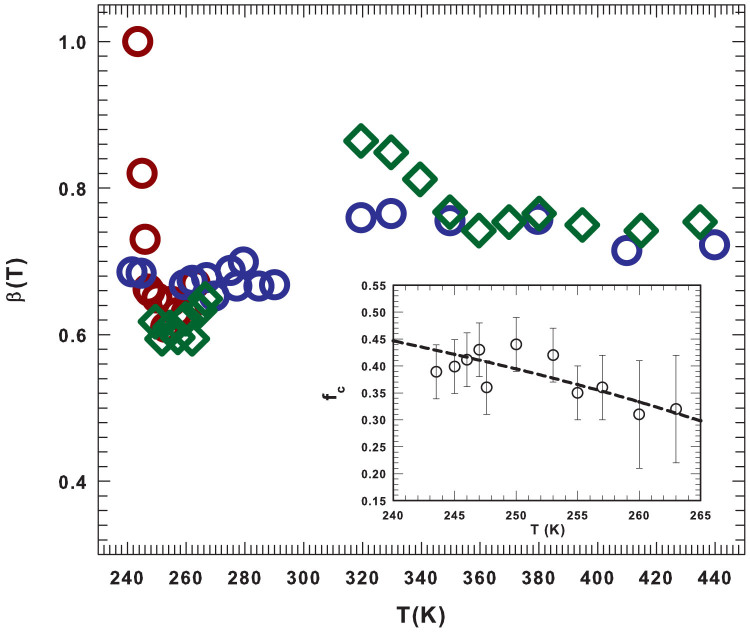
Figure 2. The OTP non-ergodicity factor fc (inset) and the stretched exponent βS obtained from the correlators and compared with the previous one obtained in the MCT frame.
The Debye-Waller factor fc is reported for different temperatures in the range 243 < T < 263 K. The dashed line represents the MCT scaling law prediction, as the temperature decreases below TB: fc ~ |TB − T|1/2. Together with actual data for βS (dark red circles) the figure reports the values of the stretched exponent measured in previous experiments: PCS (open green diamonds36) and TFPI/DM (blue circles35).

