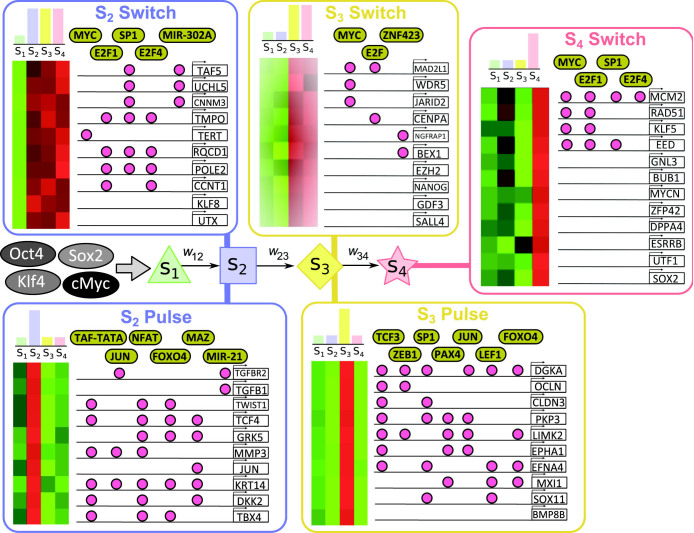
Figure 4. Cell state markers and the molecular circuitry of reprogramming.
Application of our model to data from the the reprogramming system of Samavarchi-Tehrani et al.18 yields a gene ranking that, unlike conventional differential expression and related analyses, is based on cell state-specific estimates. We used our approach to identify state marker genes and to explore the molecular circuitry underpinning reprogramming. Five state-resolved expression profiles are shown: “switches” occur when a gene is expressed in a particular cell state and remains on in subsequent states, while “pulses” occur when a gene is switched on in only one state, and is off in all other states. Estimated state-specific expression levels were used to rank genes in each profile; genes shown are selected from the top 5%, genome-wide, under each profile. Highlighted are transcription factors whose DNA binding motifs and known occupancy of promoters through ChIP data show targeting of genes in each switch or pulse, as well as micro-RNAs (MIRs) targeting the genes.

