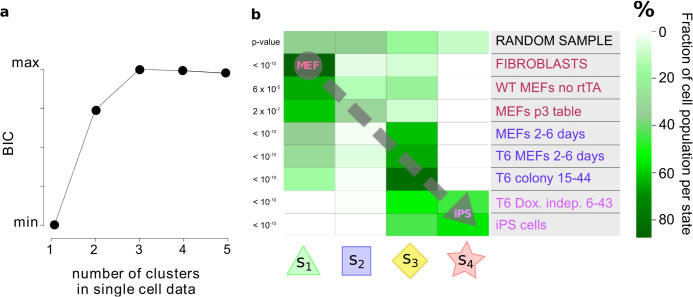
Figure 5. Testing model predictions against independent single-cell data.
Results obtained from application of our model to the microarray time-course data were tested against independent single-cell gene expression data from a secondary reprogramming system due to Buganim et al.19. (a), Number of clusters in the single-cell data. A score called the Bayesian Information Criterion (BIC) is shown as a function of number of clusters (see text for details). (b), Matching individual cells to predicted states. Single cells within different experimental populations in Buganim et al. were assigned to each of the four states in our model (all parameters were estimated using the microarray data only). Matching was done by similarity between single-cell expression profiles and the state signatures. The heatmap shows the fraction of cells in each experimental population that were assigned to each state. Assignments for different experiments show clear preference for certain states, in a manner consistent with the nature of the states, and in line with a progression towards iPS via the intermediate states defined by our model. For example, the MEF populations have a marked peak in state 1, while cell lines at the 2-to-6 days stage of reprogramming have an heterogeneous population spread over the first three states, with a peak at state 3. Finally, the populations of dox-independent colonies and iPS cells belong to state 3 and 4, peaking respectively at 3 and 4.

