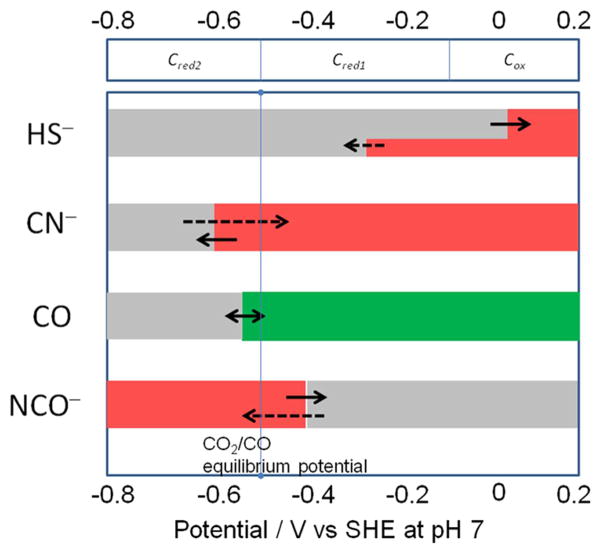
Figure 7.
Potential dependence of binding of inhibitors to CODH ICh. Red shading refers to the potential region over which the enzyme is inhibited, gray indicates no binding, and green indicates that binding leads to turnover. The dashed arrows indicate reactions that are slow compared to those indicated by full arrows. The reduction potentials indicated at the top of the chart are guiding estimates based on values reported in the literature for Cred1/Cred28,11 (close to the CO2/CO potential at pH 7) and our own observation from the voltammetry in the case of Cox/Cred1.

