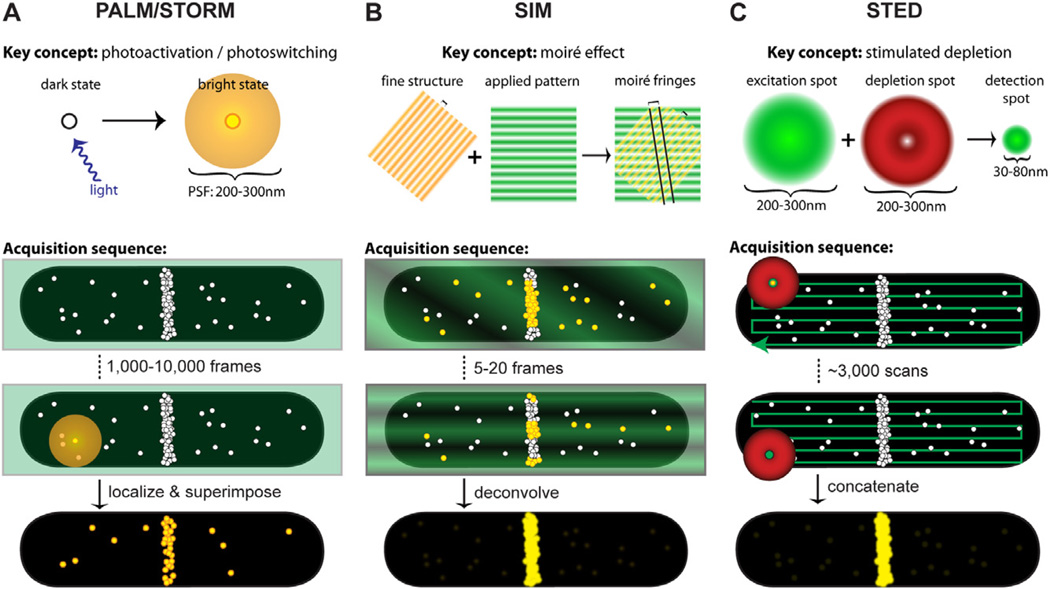
Fig. 1.
Key concepts and acquisition schematics for each superresolution technique. In each schematic, molecule positions are shown as white circles, excitation light is represented in green, depletion light is represented in red, and fluorescing molecules are highlighted in yellow. In acquisition schematics, molecule positions mimic cellular distributions of the FtsZ protein, which is the only bacterial protein that has been analysed by all three methods.
A. Single-molecule localization-based techniques such as PALM and STORM apply low levels of activation light (violet arrow) so that single molecules are stochastically activated and localized. An activated molecule produces a diffraction-limited spot (diffuse yellow circle), which is fit with a Gaussian function to localize the molecule’s position with nanometre precision. After hundreds to thousands of molecules have been localized, their positions are superimposed to create the superresolution image (bottom).
B. SIM utilizes the moiré effect, which results when an illumination pattern (green stripes) is applied to a specimen with fine structures that are smaller than the diffraction limit (e.g. closely spaced yellow stripes or molecule positions). Interference between the illumination pattern and the sample produces moiré fringes (two are shown as diagonal black lines) that are spaced further apart than the underlying sample spacing, thus visualizing sub-diffraction-limited features. Several illumination patterns are applied to the sample, then spatial information extracted from the Fourier transforms of each image is combined to generate the superresolution image (bottom). Although the emission from fluorescing molecules (yellow circles) is diffraction-limited, the diffraction-limited profiles are omitted for clarity.
C. For STED imaging, concentric excitation and depletion beams (green circle and red donut respectively) are projected onto a sample. Although fluorophores are excited throughout the diffraction-limited excitation spot (large green circle), the depletion beam (red donut) stimulates molecules outside the central 30–80 nm region back to the ground state before they fluoresce, generating a superresolution PSF (small green circle). These beams are scanned across the specimen to collect the superresolution image (bottom).

