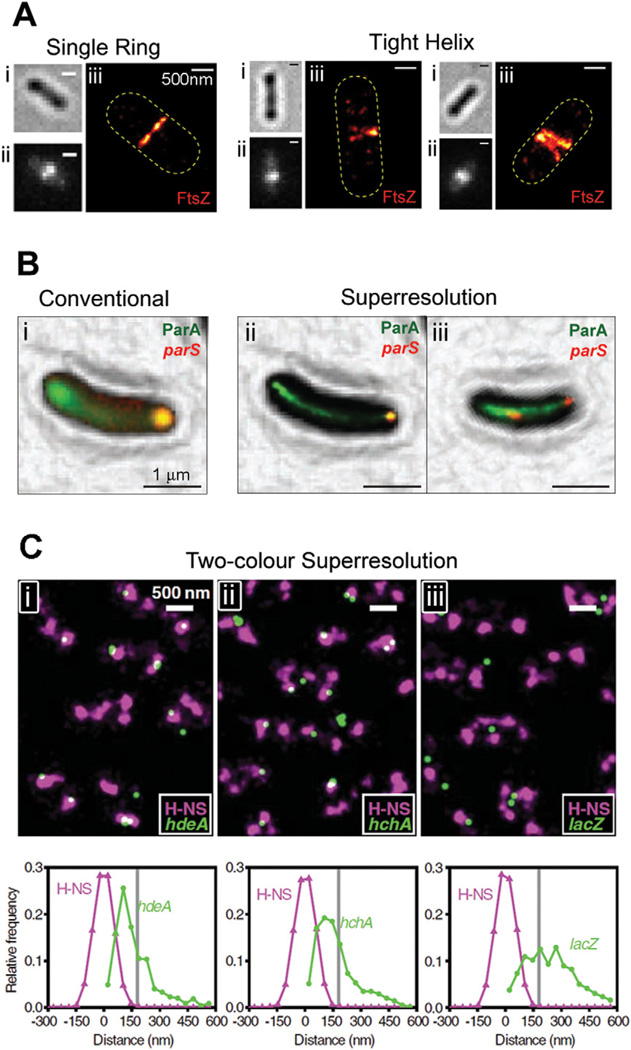
Fig. 2.
Single-molecule localization-based superresolution images.
A. Superstructures formed by FtsZ-mEos2 in E. coli. For each cell, the brightfield (i), conventional fluorescence (ii) and superresolution (iii) images are shown. Although each conventional fluorescence image (ii) shows a single midcell band, the two right panels show that these structures are sometimes resolved into tight helix conformations by PALM imaging (iii). Bars, 500 nm.
B. Colocalization between ParA-eYFP (green) and mCherry-ParB (red), which binds to the parS locus on the C. crescentus chromosome. The diffuse eYFP fluorescence in the conventional image (i) is resolved into tight linear bundles in the superresolution images (ii and iii). Both mCherry-labelled loci are at the same pole in a young cell (ii), but are clearly segregated in a late-stage cell (iii). Bars, 1 µm.
C. Colocalization between mEos2-labelled H-NS (purple) and eYFP-labelled gene loci (green) in live E. coli cells. Each field (i, ii, iii) shows several cells with two to four clusters of H-NS per cell. Histograms underneath each field describe distance distributions between gene loci and their nearest H-NS clusters for hdeA (i) and hchA (ii), which are organized by H-NS, and lacZ (iii), which is not organized by H-NS. Bars, 500 nm.
Images are reproduced with permission from Fu et al. (2010) (A), Ptacin et al. (2010) (B) and Wang et al. (2011) (C).

