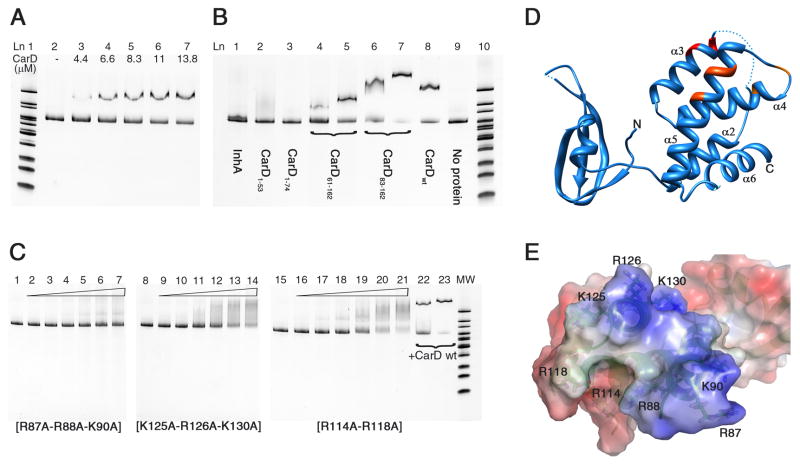
Figure 5. DNA binding activity of Mtb CarD determined by EMSA.
(A) CarD interaction with upstream DNA of 16S rRNA gene (313 bp). Lane 1: MW (molecular weight) marker. Lane 2: DNA probe, no protein. Lanes 3–7: 4.4–13.8 μM CarD. (B) Interaction of CarD domains and a well known non-DNA binding protein with 16S rRNA upstream DNA probe. Lane 1: InhA (10 μM). Lane 2: CarD1–53 (10 μM). Lane 3: CarD1–74 (10 μM). Lanes 4–5: CarD61–162 (5 and 10 μM). Lanes 6–7: CarD83–162 (5 and 10 μM). Lane 8: CarD full length (10 μM). Lane 9: 16S rRNA upstream DNA probe, no protein. Lane 10: MW marker. (C) EMSA experiments with CarD mutant proteins. Mutation of Arg and Lys residues to Ala significantly reduced the DNA binding activity of Mtb CarD. R87A-R88A-K90A showed the greatest effect. Lanes 1, 8, 15: 16S rRNA upstream DNA probe, no protein. Lanes 2–7, 9–14, 16–21: 0–44 μM mutant CarD protein (as labeled on the gel). Lanes 22–23: 11 and 22 μM native CarD. (D, E) Mutations are mapped on the ribbon representation and electrostatic potential surface of CarD. R87-R88-K90 are red, K125-R126-K130 are dark orange, and R114–R118 are light orange. Gel imaging was done using the Bio-Rad Chemidoc XRS+ molecular imager, by excitation at 255 nm and emission at 520 nm. Electrostatic potential surface calculations were done with PyMol (The PyMOL Molecular Graphics System, Version 0.99rc6, Schrödinger, LLC) using APBS as the macromolecular electrostatics calculation program(Baker et al., 2001).

