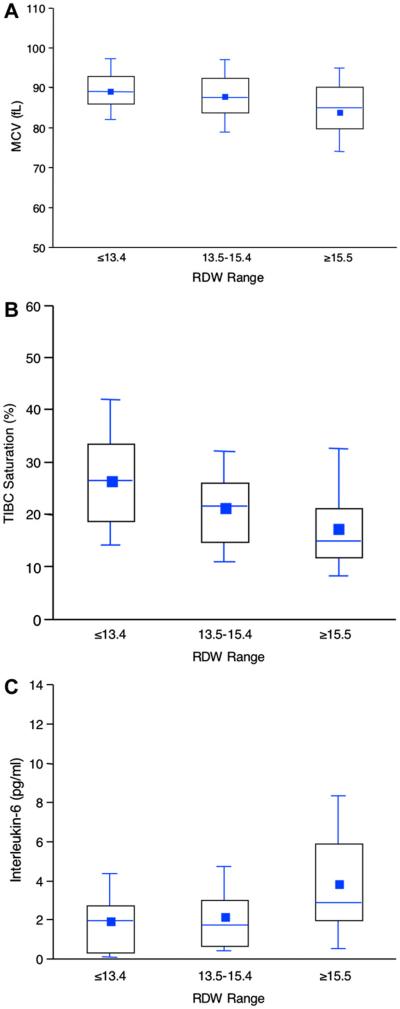
Fig. 2.
Relationship of red cell distribution width to indices of iron metabolism and inflammation. Association of ranges of red cell distribution width with mean corpuscular volume (A), total iron binding capacity (TIBC) saturation (B), and interleukin (IL)-6 (C). Boxes illustrate the 25th, 50th, and 75th percentiles of the distribution. The mean is given by a square, the median by the horizontal line, and the whiskers extend to the 5th and 95th percentiles.

