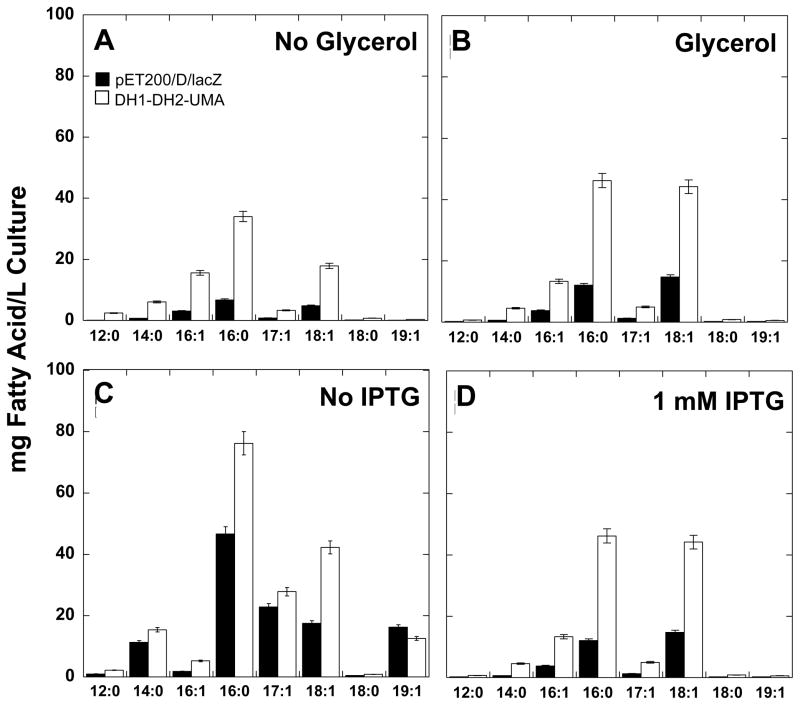
Figure 5. Effect of culture media supplementation.
Fatty acid profiles were determined for DH1-DH2-UMA (white bars) and pET200/D/lacZ controls (black bars) as described previously. Fatty acid titers were measured (A) without supplementation and (B) with supplementation of 0.4 % glycerol as a carbon source. These experiments were carried out at 22°C and with 1 mM IPTG. In separate experiments, fatty acid titers were measured (C) without IPTG and (D) with 1mM IPTG added to the culture media. These experiments were carried out at 22°C and with 0.4% glycerol. Error bars represent standard deviations about the mean of two or three replicate samples.

