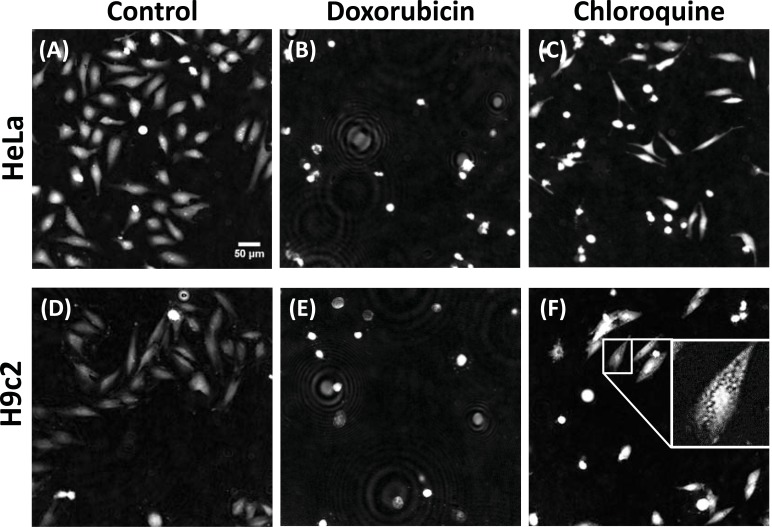
Fig. (2).
Compound induced phenotypes. Representative endpoint (24 h) images of HeLa (A, B, C) and H9c2 (D, E, F) cells in control condition (A, D) treated with 30 µM doxorubicin (B, E) or 30 µM chloroquine (C, F). Scale bar: 50 µm. All images are drawn with the same intensity levels (except inset image). Ring pattern in the doxorubicin images are dead cells detached from the well-plate.

